Súðavík Weather & Climate: Best Time to Visit
Average temperatures, rainfall, sunshine and the best time to visit Súðavík.
Climate overview of Súðavík
Súðavík, Westfjords, Iceland, experiences significant temperature variation throughout the year. Summers bring daytime highs of 12°C (54°F) in July, while winters cool to 1°C (34°F) in February.
The city has a wet climate, receiving around 1311 mm (52 in) of rain/snowfall per year. December is the wettest month.
Súðavík Weather by Month
Pick a month to see the average temperature, rainfall and sunshine in Súðavík — and find the best time to visit.
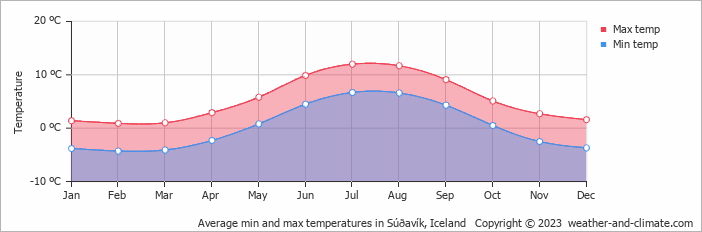
Monthly Temperature in Súðavík
Depending on the time of the year, temperatures range from moderate to very cold in Súðavík. On average, daytime temperatures range from a moderate 12°C (54°F) in July to a very cold 1°C (34°F) in February.
Nighttime temperatures range from 7°C (45°F) in July to -4°C (25°F) in February.
Check out our detailed temperature page for more information.
Temperature ranges by month
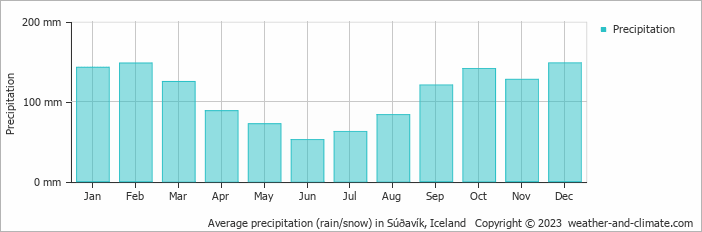
Rainfall in Súðavík
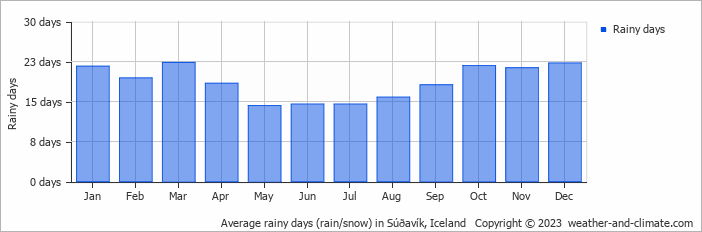
Súðavík has a relatively rain/snowy climate with high precipitation levels, averaging 1311 mm (52 in) of rain/snowfall annually. The seasons in Súðavík bring significant changes in precipitation. The wettest month, December, receives high snow/rainfall, with an average of 148 mm (5.8 in) of precipitation. This snow/rainfall is distributed across 22 snowy/rainy days.
In contrast, the driest month, June, experiences much less rainfall, totaling 52 mm (2 in) over 15 rainy days. These distinct seasonal differences provide diverse experiences throughout the year. For more details, please visit our Súðavík Precipitation page.
The mean monthly precipitation over the year, including rain, hail, and snow
The average number of days each month with precipitation
Best Time to Visit Súðavík
Check the specific monthly conditions to plan your visit according to your weather preferences and planned activities. Seeking the perfect travel destination for this year? We've created a tool that suggests locations matching your desired weather. Let our weather planner guide your travel decisions.
Frequently asked questions about the climate in Súðavík
What is the best time to visit Súðavík?
July and August typically offer the most optimal weather in Súðavík. In contrast, January, February, March, April, May, June, September, October, November and December tend to have less optimal conditions.
What temperatures can I expect in Súðavík?
Daytime highs range from 1°C (34°F) in February to 12°C (54°F) in July. Nighttime lows range from -4°C (25°F) to 7°C (45°F). Temperatures vary considerably through the year.
How much rain does Súðavík get?
Annual rainfall is around 1311 mm (52 in). December is the wettest month with 148 mm (5.8 in), while June is the driest with 52 mm (2 in). In the coldest months, precipitation may fall as snow/rain.
Súðavík 3-Day Forecast
Súðavík 3-Day Forecast
Súðavík on the map
Súðavík is highlighted — select any city to see its climate.
Popular this month
Where to go in July — average daytime high across popular destinations.
Bucket list
Need travel inspiration? Check out our bucket list articles and be inspired.
 Iceland Airwaves Festival
On its way to its 20th edition in 2019 Iceland Airwaves is a festival you need to visit once in your life. Everything from lagoons and bookstores to bars and concert halls is filled with music.
Where to stay in Iceland: Nordic idyll that feels like home
If you are travelling to Iceland for the first time, the Golden Circle will probably make it onto your bucket list. Geysir Hestar is located right in between two spectacular sights of the Golden Circle.
 See the northern lights
The northern lights, polar light or Aarora Borealis is a true spectacle of nature! Green, sometimes purple, red and yellow streaks of light colors the dark skies.