Siliqua Weather & Climate: Best Time to Visit
Average temperatures, rainfall, sunshine and the best time to visit Siliqua.
Climate overview of Siliqua
Siliqua, Sardinia, Italy, sees big temperature differences between seasons, with August peaking at 33°C (91°F) and February dropping to 15°C (59°F).
Siliqua sees a moderate amount of rainfall, totalling around 523 mm (21 in) per year. It experiences a distinct dry season from June to August, creating some seasonal variation. The most sunshine falls in July, with an average of 11.4 hours of daily sunshine.
Siliqua Weather by Month
Pick a month to see the average temperature, rainfall and sunshine in Siliqua — and find the best time to visit.
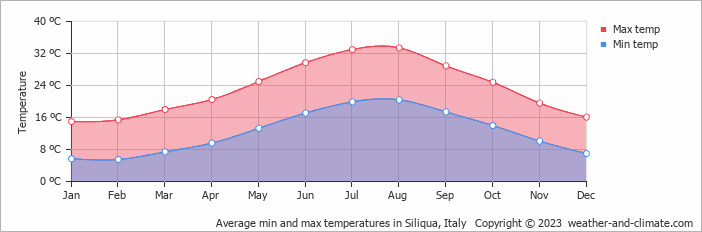
Monthly Temperature in Siliqua
Visitors to Siliqua can expect significant temperature changes throughout the year. Average maximum daytime temperatures range from a very warm 33°C (91°F) in August, the warmest time of the year, to a moderate 15°C (59°F) during cooler months like February.
At night, you can expect temperatures ranging from 20°C (68°F) in August to around 6°C (43°F) during February.
Check out our detailed temperature page for more information.
Temperature ranges by month
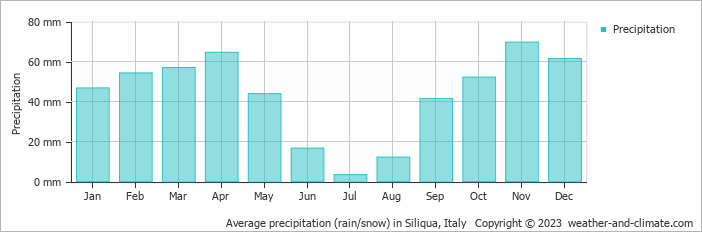
Rainfall in Siliqua
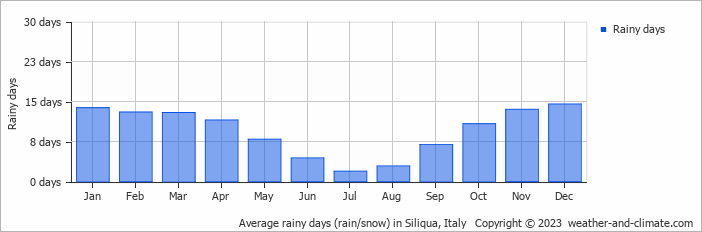
Generally, Siliqua experiences moderate precipitation patterns, averaging 523 mm (21 in) yearly. Significant seasonal changes in precipitation occur throughout the year. In the wettest month, November it receives moderate rainfall, averaging 70 mm (2.8 in) of precipitation, recorded across 14 rainy days. In contrast, the driest month July brings less rainfall, with 3.3 mm (0.1 in) over 2 rainy days. For more details, please visit our Siliqua Precipitation page.
The mean monthly precipitation over the year, including rain, hail, and snow
The average number of days each month with precipitation
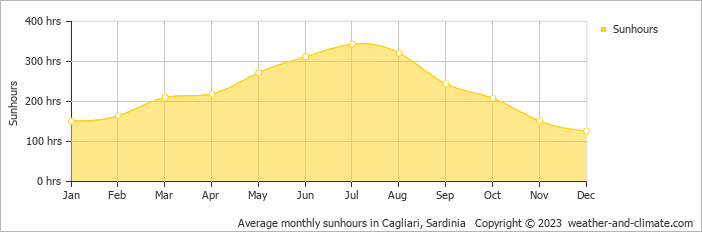
Sunshine Hours in Siliqua
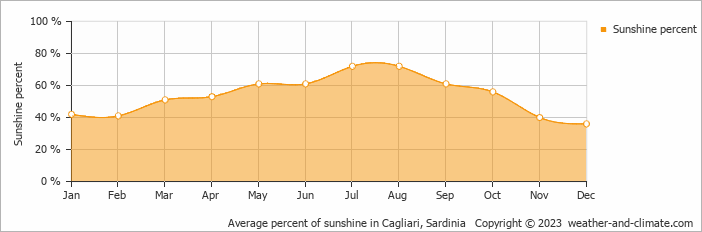
Seasonal changes in sunshine hours are quite dramatic in Siliqua. While July receives considerable daily sunshine with up to 11.4 hours, December marks the darkest time of the year, where sunshine is scarce with only 4.2 hours of sunlight per day.
Visit our detailed sunshine hours page for more information.
Monthly hours of sunshine
Daily hours of sunshine
Daily percentage of sunshine
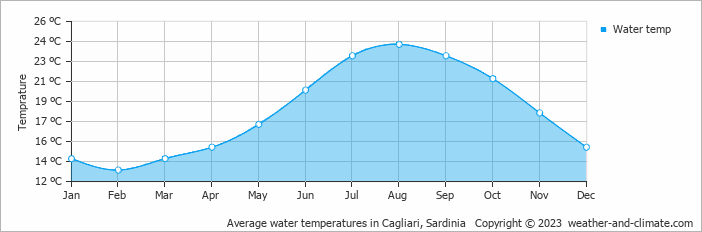
Water Temperature in Siliqua
The mean water temperature over the year ranges from 13°C (55°F) in February to 24°C (75°F) in August.
Water temperature over the year
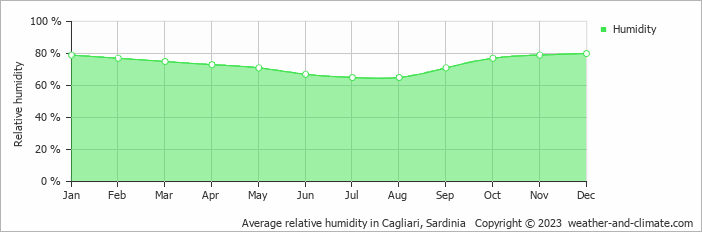
Humidity in Siliqua by Month
The relative humidity is high throughout the year in Siliqua.
The city experiences its highest humidity in December, reaching 80%. In July, the humidity drops to its lowest level at 65%. What does this mean? Read our detailed page on humidity levels for further details.
Relative humidity over the year
Best Time to Visit Siliqua
The weather does bring rainfall during this period, between 17 mm (0.7 in) and 70 mm (2.8 in). Looking for inspiration on where to travel this year? We have a tool that recommends destinations based on your ideal conditions. Find out where to go with our weather planner.
Frequently asked questions about the climate in Siliqua
What is the best time to visit Siliqua?
April, May, September, October and November typically offer the most optimal weather in Siliqua. In contrast, January, February, July, August and December tend to have less optimal conditions. Siliqua has a distinct dry season from June to August.
What temperatures can I expect in Siliqua?
Daytime highs range from 15°C (59°F) in February to 33°C (91°F) in August. Nighttime lows range from 6°C (43°F) to 20°C (68°F). Temperatures vary considerably through the year.
How much rain does Siliqua get?
Annual rainfall is around 523 mm (21 in). November is the wettest month with 70 mm (2.8 in), while July is the driest with 3.3 mm (0.1 in).
How sunny is Siliqua?
Siliqua receives around 2,721 hours of sunshine per year. July is the sunniest month with 343 hours, while December is the cloudiest with just 126 hours. Overall, Siliqua enjoys abundant sunshine.
Siliqua 3-Day Forecast
Siliqua 3-Day Forecast
Siliqua on the map
Siliqua is highlighted — select any city to see its climate.
Popular this month
Where to go in June — average daytime high across popular destinations.
Bucket list
Need travel inspiration? Check out our bucket list articles and be inspired.
 The 10 most beautiful historical towns in Italy
Discover Italy's top 10 historic towns, featuring breathtaking medieval architecture and deep-rooted history, ideal for enthusiasts of extraordinary cities.
Experience mystical Assisi
Assisi is the most famous town in Umbria and best known because of Saints Francis and Clare of Assisi. Many visitors come to see the breathtaking San Francesco basilica.
The Battle of Oranges
This is one of the most unusual festivals in Italy. The festival is held in the middle of winter during the winter carnival. The entire city of Ivrea near Turin turns into a battlefield.
The most beautiful fishing village of Italy
Portofino is the most beautiful fishing village in Italy and maybe even in the world. We absolutely recommend that you add this beautiful place to your bucket list.