Average monthly water temperature in Siliqua, Italy
On this page you find the mean water temperature over the year in Siliqua (Sardinia), Italy. Take a closer look at the water temperature patterns and what they mean for swimming and recreation.
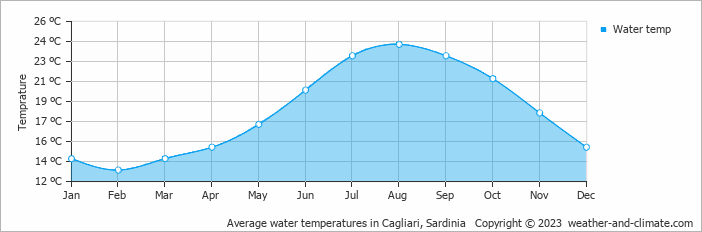
Data from: Cagliari, Sardinia (21 KM, 13 Miles).
Water temperatures in Siliqua fluctuate across the seasons. The warmest month, August, averages 24°C (75°F).
The coldest water temperature month is February, averaging 13°C (55°F). Seasonal shifts offer opportunities to explore different activities depending on the time of year.


