Rybnik Weather & Climate: Best Time to Visit
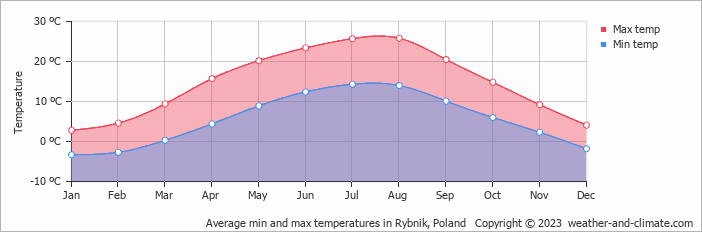
Rybnik, Silesia, Poland, sees big temperature differences between seasons, with August peaking at 26°C (79°F) and January dropping to 3°C (37°F).
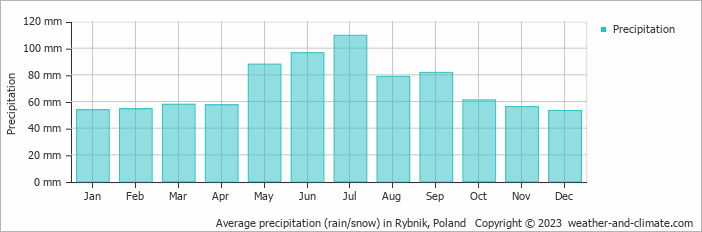
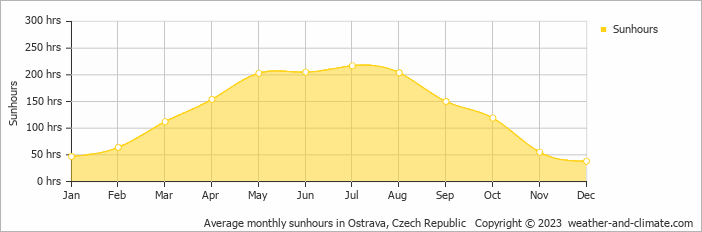
The city receives around 848 mm (33 in) of rain/snowfall per year. July is the wettest month and December the driest. The sunniest month is July, with 7.2 hours of sunshine per day on average.
Monthly Temperature in Rybnik
Visitors to Rybnik can expect significant temperature changes throughout the year. On average, daytime temperatures range from a comfortable 26°C (79°F) in August to a chilly 3°C (37°F) in January.
Nighttime temperatures range from 14°C (57°F) in August to -3°C (27°F) in January.
Check out our detailed temperature page for more information.
Temperature ranges by month
Rainfall in Rybnik
Generally, Rybnik experiences moderate precipitation patterns, averaging 848 mm (33 in) yearly. The amount of precipitation varies moderately throughout the year. The wettest month, July, sees around 110 mm (4.3 in) of rainfall, perfect for those who enjoy a bit of rain now and then. The driest month, December, still receives a respectable 53 mm (2.1 in) of snow/rainfall. For more details, please visit our Rybnik Precipitation page.
The mean monthly precipitation over the year, including rain, hail, and snow
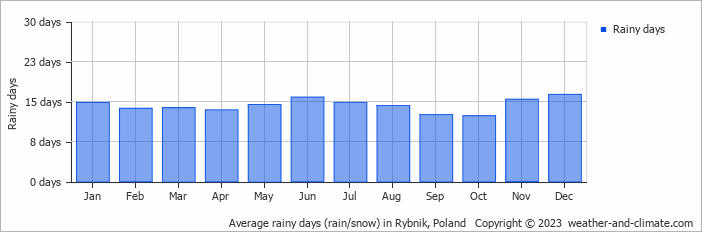
The average number of days each month with precipitation
Sunshine Hours in Rybnik
In Rybnik, summer days are longer and more sunny, with daily sunshine hours peaking at 7.2 hours in July. As the darker season arrives, the brightness of the sun becomes less. December sees a soft sun for only 1.3 hours per average day.
Visit our detailed sunshine hours page for more information.
Monthly hours of sunshine
Daily hours of sunshine
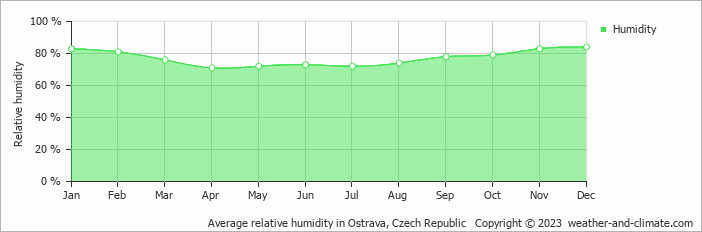
Humidity in Rybnik by Month
The relative humidity is high throughout the year in Rybnik.
The city experiences its highest humidity in December, reaching 84%. In April, the humidity drops to its lowest level at 71%. What does this mean? Read our detailed page on humidity levels for further details.
Relative humidity over the year
Rybnik 3-Day Forecast
Check the conditions for any month of the year.
Best Time to Visit Rybnik
During May, June, July, August and September, Rybnik experiences its most favorable weather, with temperatures between 20°C (68°F) and 26°C (78°F). These mild conditions make it an excellent time for a visit.The weather does bring rainfall during this period, between 79 mm (3.1 in) and 110 mm (4.3 in). Seeking the perfect travel destination for this year? We've created a tool that suggests locations matching your desired weather. Let our weather planner guide your travel decisions.


