Ricaurte Weather & Climate: Best Time to Visit
Ricaurte, Cundinamarca, Colombia, has a stable climate with little temperature variation across the year. Average daytime temperatures hover around 30°C (86°F), peaking in February at 32°C (90°F) and dipping in July to 30°C (86°F).
The city has a wet climate, receiving around 4289 mm (169 in) of rainfall per year. May is the wettest month. August is the sunniest month, averaging 6.5 hours of sunshine per day.
Monthly Temperature in Ricaurte
With minimal seasonal shifts, Ricaurte experiences a constant climate year-round. On average, daytime temperatures range from a very warm 32°C (90°F) in February to a comfortable 30°C (86°F) in July.
Nighttime temperatures range from 22°C (72°F) in February to 21°C (70°F) in July.
Check out our detailed temperature page for more information.
Temperature ranges by month

Rainfall in Ricaurte
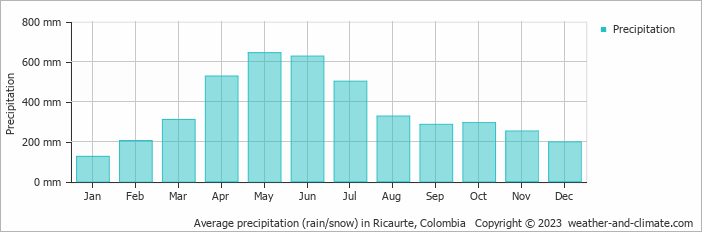
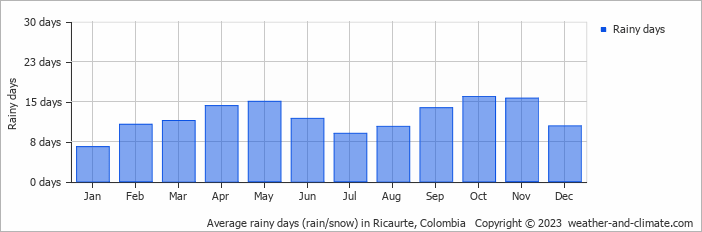
Ricaurte has a notably wet climate with abundant precipitation, recording 4289 mm (169 in) of rainfall per year. The seasons in Ricaurte bring significant changes in precipitation. The wettest month, May, receives heavy rainfall, with an average of 643 mm (25 in) of precipitation. This rainfall is distributed across 15 rainy days.
In contrast, the driest month, January, experiences much less rainfall, totaling 125 mm (4.9 in) over 7 rainy days. These distinct seasonal differences provide diverse experiences throughout the year. For more details, please visit our Ricaurte Precipitation page.
The mean monthly precipitation over the year, including rain, hail, and snow
The average number of days each month with precipitation
Sunshine Hours in Ricaurte
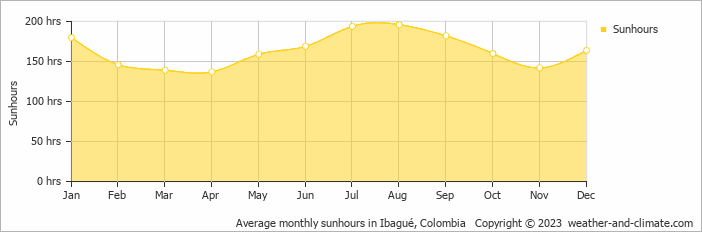
Ricaurte enjoys sunny spells year-round. August sees up to 6.5 hours of daily sunshine, perfect for a sunny trip. April, the least sunny month, still offers a generous 4.6 hours of sun despite this cloudier time of the year.
Visit our detailed sunshine hours page for more information.
Monthly hours of sunshine
Daily hours of sunshine
Humidity in Ricaurte by Month
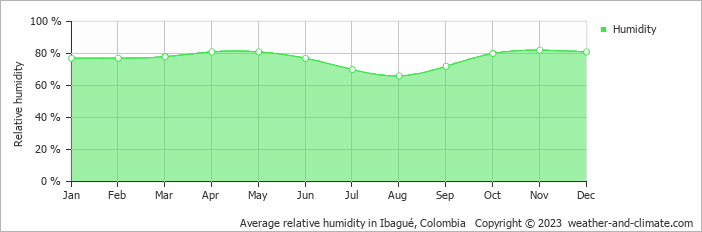
The relative humidity is high throughout the year in Ricaurte.
The city experiences its highest humidity in November, reaching 82%. In August, the humidity drops to its lowest level at 66%. What does this mean? Read our detailed page on humidity levels for further details.
Relative humidity over the year
Ricaurte 3-Day Forecast
Check the conditions for any month of the year.
Best Time to Visit Ricaurte
With its warm weather, Ricaurte experiences temperatures from 30°C (86°F) to 32°C (90°F) throughout the year. January, February and December offers the driest weather, which makes it a good time to visit.It's smart to plan your activities during the cooler morning hours or take advantage of the refreshing evenings. Seeking the perfect travel destination for this year? We've created a tool that suggests locations matching your desired weather. Let our weather planner guide your travel decisions.


