Radazul Weather & Climate: Best Time to Visit
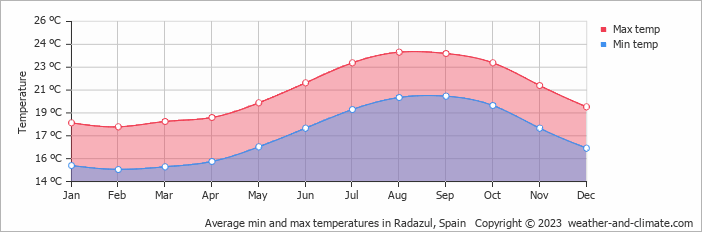
With consistently stable weather, Radazul, Canary Islands, Spain, sees little seasonal temperature change. Daytime highs average 21°C (70°F), ranging from 24°C (75°F) in August to 18°C (64°F) in February.
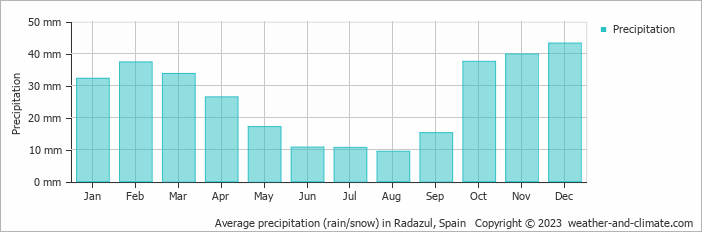
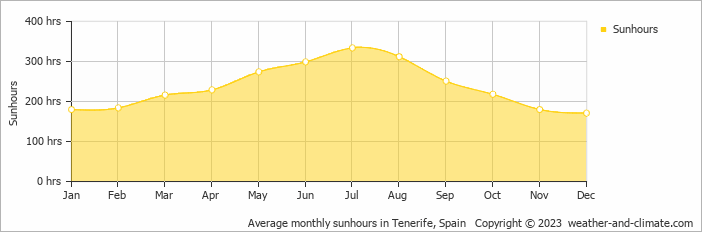
Rainfall is modest, totalling around 313 mm (12 in) annually. The city experiences a distinct dry season from January to November. December tends to be the wettest month. The most sunshine falls in July, with an average of 11.1 hours of daily sunshine.
Monthly Temperature in Radazul
The climate in Radazul remains fairly constant, offering pleasant temperatures throughout the year. Average maximum daytime temperatures range from a comfortable 24°C (75°F) in August, the warmest time of the year, to a pleasant 18°C (64°F) during cooler months like February.
At night, you can expect temperatures ranging from 20°C (68°F) in August to around 15°C (59°F) during February.
Check out our detailed temperature page for more information.
Temperature ranges by month
Rainfall in Radazul
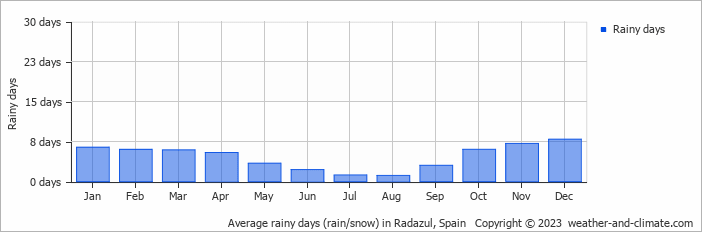
Radazul tends toward drier weather patterns, receiving approximately 313 mm (12 in) of rain per year. Significant seasonal changes in precipitation occur throughout the year. In the wettest month, December it receives moderate rainfall, averaging 43 mm (1.7 in) of precipitation, recorded across 8 rainy days. In contrast, the driest month August brings less rainfall, with 9.4 mm (0.4 in) over a single rainy day. For more details, please visit our Radazul Precipitation page.
The mean monthly precipitation over the year, including rain, hail, and snow
The average number of days each month with precipitation
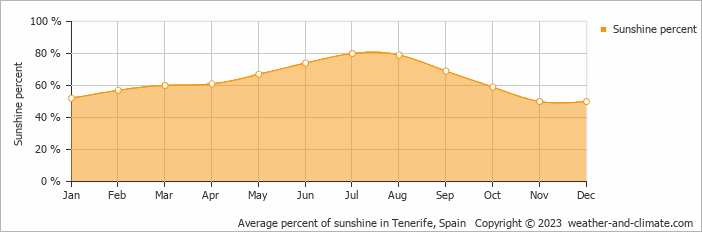
Sunshine Hours in Radazul
Seasonal changes in sunshine hours are quite dramatic in Radazul. While July receives considerable daily sunshine with up to 11.1 hours, December marks the darkest time of the year, where sunshine is scarce with only 5.7 hours of sunlight per day.
Visit our detailed sunshine hours page for more information.
Monthly hours of sunshine
Daily hours of sunshine
Daily percentage of sunshine
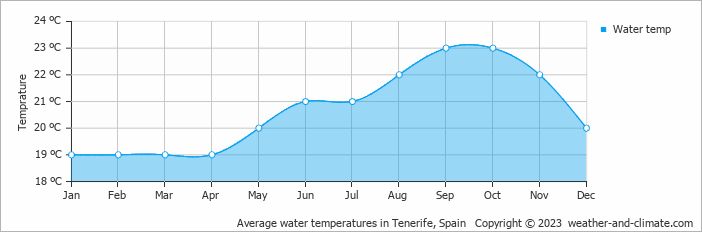
Water Temperature in Radazul
The mean water temperature over the year ranges from 19°C (66°F) in January to 23°C (73°F) in September.
Water temperature over the year
Humidity in Radazul by Month
The relative humidity is high throughout the year in Radazul.
The city experiences its highest humidity in November, reaching 66%. In July, the humidity drops to its lowest level at 55%. What does this mean? Read our detailed page on humidity levels for further details.
Relative humidity over the year

Radazul 3-Day Forecast
Check the conditions for any month of the year.
Best Time to Visit Radazul
The exceptional weather stability in Radazul provides comfortable temperatures between 18°C (65°F) and 24°C (75°F) throughout every month of the year. This consistent climate removes all guesswork from travel planning, though the drier periods offer optimal conditions.While you can visit anytime with confidence, the drier months like August (with just 9 mm (0.4 in) rainfall) provide the most favorable conditions for extended outdoor exploration and flexible itineraries. Need help choosing your next travel destination? We offer a specialized tool that matches you with locations based on your weather preferences. Explore destinations that suit your climate preferences.


