Quilotoa Weather and Climate: A Comprehensive Guide
Quilotoa has pretty similar weather over the course of the year.
It is also known for its large amounts of rainfall.
Let’s explore the climate details in depth to provide you with a complete overview.
Average maximum day and minimum night temperature
With minimal seasonal shifts, Quilotoa experiences a constant climate year-round. Typically, average maximum daytime temperatures range from a pleasant 18°C in April to a moderate 18°C in the coolest month, August.
Nights are cooler, with lows often dropping to around 9°C during the colder months.Check out our detailed temperature page for more information.
Temperature ranges by month

Precipitation and rainy days
Quilotoa has a notably wet climate with abundant precipitation, recording 4271 mm of rainfall per year. Quilotoa offers a pleasant mix of wetter and slightly drier months. The difference in precipitation between March (485 mm) and July (248 mm) is not too significant, making the climate enjoyable for visitors and residents alike.
The mean monthly precipitation over the year, including rain, hail and snow

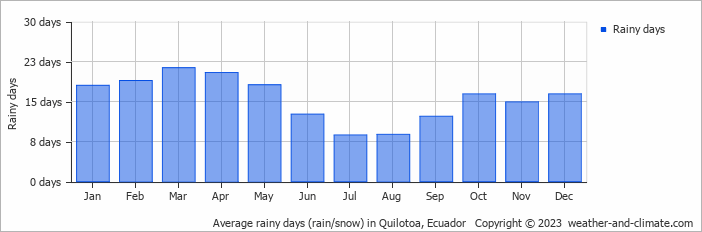
The average number of days each month with precipitation
broken clouds and thunder broken clouds and thunder broken clouds and rainForecast for Quilotoa
 2 m/s
2 m/s![]() 2 m/s
2 m/s![]() 2 m/s
2 m/s![]()
Select a Month of Interest
Check the conditions for any month of the year.
The best time of year to visit Quilotoa in Ecuador
Quilotoa has moderate temperatures year round ranging between 17°C and 18°C. The average rainfall figures in Quilotoa are quite high. Throughout the year, you have a chance of prolonged precipitation. So no matter what time of year you go, you will always have to deal with a high number of rainy days. This makes it more challenging to point out the best time of year to visit. Other facts from our historical weather data:April has an average maximum temperature of 18°C and is the warmest month of the year.
The coldest month is August with an average maximum temperature of 18°C.
March tops the wettest month list with 485 mm of rainfall.
July is the driest month with 248 mm of precipitation.
No idea where to travel to this year? We have a tool that recommends destinations based on your ideal conditions. Find out where to go with our weather planner.


