Average monthly rainy days in Quilotoa
The number of days each month with rain, snow and hail in Quilotoa (), Ecuador.
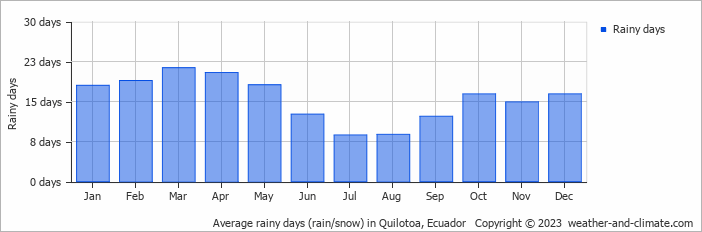
- Most rainy days are in January, February, March, April, May, October and December.
- On average, March is the most rainy with 21 days of rain/snow.
- On average, July is the driest month with 8 rainy days.
- The average annual number of rainy days is 186.
Forecast for Quilotoa
Sun May 05
13°C | 6°C
E  14 km/h
14 km/h6.4 mm
overcast and rain
Mon May 06
14°C | 6°C
E 11 km/h
11 km/h9.6 mm
broken clouds and rain
Tue May 07
13°C | 6°C
E 7 km/h
7 km/h9.5 mm
broken clouds and rain