Piratininga Weather & Climate: Best Time to Visit
The climate in Piratininga, Brazil, is remarkably consistent, with temperatures year-round averaging 29°C (84°F). The warmest month is February at 32°C (90°F), and the coolest is July at 26°C (79°F).
Rainfall is high, totalling around 1279 mm (50 in) per year. January is the wettest month and August the driest. Sunshine peaks in January, when the city sees around 7.1 hours of sunshine per day.
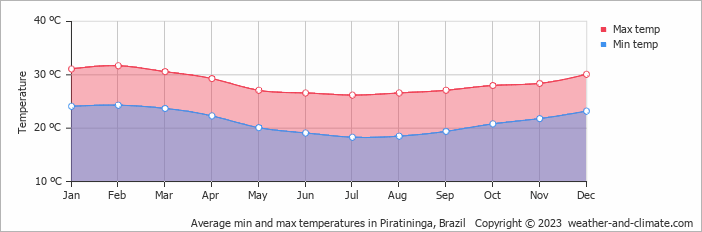
Monthly Temperature in Piratininga
In Piratininga temperatures are generally consistent throughout the year. Average maximum daytime temperatures range from a very warm 32°C (90°F) in February, the warmest time of the year, to a comfortable 26°C (79°F) during cooler months like July.
At night, you can expect temperatures ranging from 24°C (75°F) in February to around 18°C (64°F) during July.
Check out our detailed temperature page for more information.
Temperature ranges by month
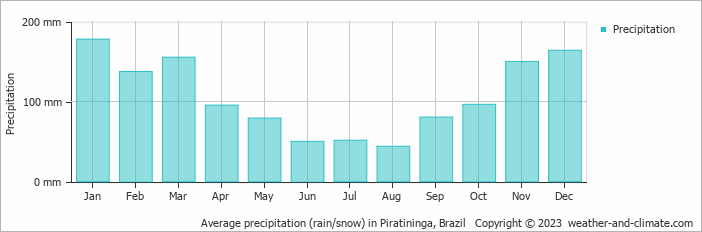
Rainfall in Piratininga
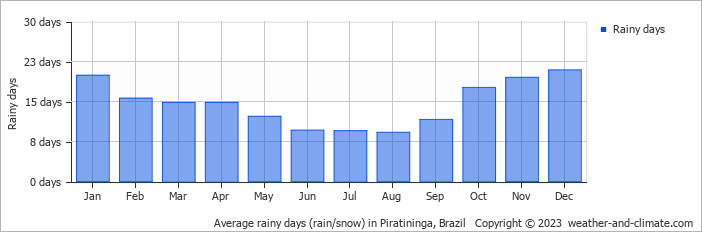
Piratininga experiences significant rainfall throughout the year, averaging 1279 mm (50 in) of precipitation annually. Significant seasonal changes in precipitation occur throughout the year. In the wettest month, January it receives heavy rainfall, averaging 178 mm (7 in) of precipitation, recorded across 20 rainy days. In contrast, the driest month August brings less rainfall, with 44 mm (1.7 in) over 9 rainy days. For more details, please visit our Piratininga Precipitation page.
The mean monthly precipitation over the year, including rain, hail, and snow
The average number of days each month with precipitation
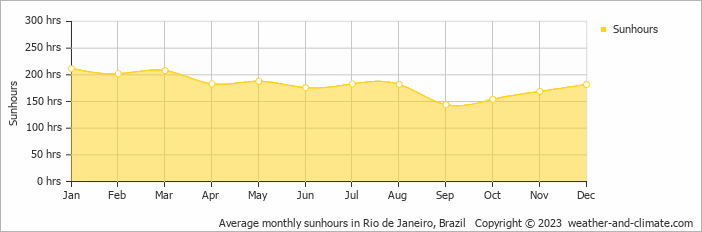
Sunshine Hours in Piratininga
While the amount of sunshine in Piratininga varies throughout the year, all seasons offer their own charm. Enjoy up to 7.1 hours of daily sun in January, and experience slightly darker atmosphere in September, with about 4.8 hours of daily sunlight.
Visit our detailed sunshine hours page for more information.
Monthly hours of sunshine
Daily hours of sunshine
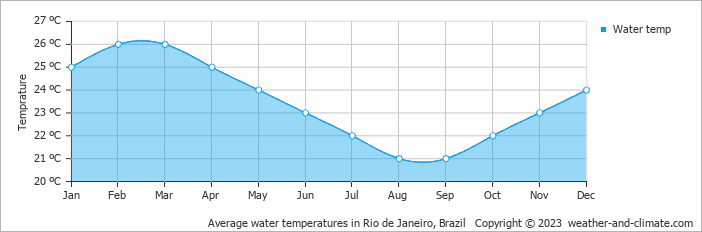
Water Temperature in Piratininga
The mean water temperature over the year ranges from 21°C (70°F) in August to 26°C (79°F) in February.
Water temperature over the year
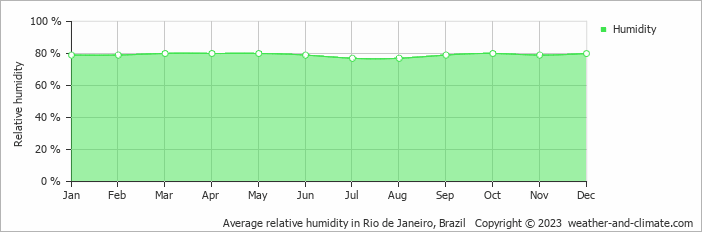
Humidity in Piratininga by Month
The relative humidity is high throughout the year in Piratininga.
The city experiences its highest humidity in March, reaching 80%. In July, the humidity drops to its lowest level at 77%. What does this mean? Read our detailed page on humidity levels for further details.
Relative humidity over the year
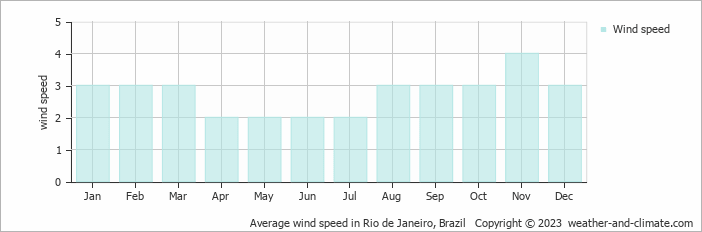
Wind Speed in Piratininga
The mean wind speed over the year ranges from 2 m/s (4 knots) in April, May, June and July to 4 m/s (8 knots) in November. What does this mean?
The mean monthly wind speed over the year (meters per second)
Piratininga 3-Day Forecast
Check the conditions for any month of the year.
Best Time to Visit Piratininga
The warm weather in Piratininga maintains temperatures between 26°C (79°F) and 32°C (90°F) year-round. Plan your visit during June, July and August for drier days and the best conditions to enjoy being outside.To make the most of your visit, consider exploring early in the morning or during the pleasant late afternoon hours when the temperature is most comfortable.
Be aware that January and December constitute the rainy season, with significant precipitation. Need help choosing your next travel destination? We offer a specialized tool that matches you with locations based on your weather preferences. Explore destinations that suit your climate preferences.