Patalavaca Weather and Climate: A Comprehensive Guide
Patalavaca has a steady warm climate throughout the year.
The city has a dry climate with very low precipitation levels.
Now, let’s explore all the climate details to give you a full picture.
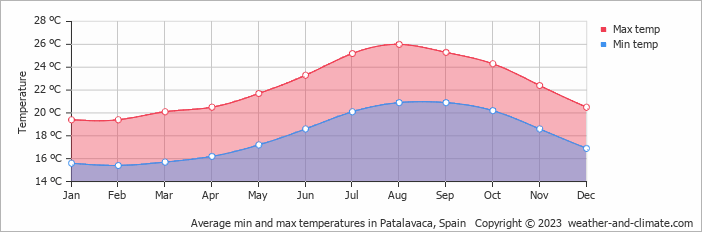
Average maximum day and minimum night temperature
In Patalavaca temperatures are generally consistent throughout the year. On average, daytime temperatures range from a comfortable 26°C in August to a pleasant 19°C in February.
Nighttime temperatures can drop, with average lows reaching 15°C in February. Check out our detailed temperature page for more information.Temperature ranges by month
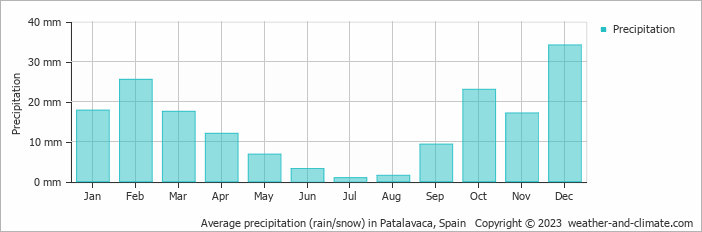
Precipitation and rainy days
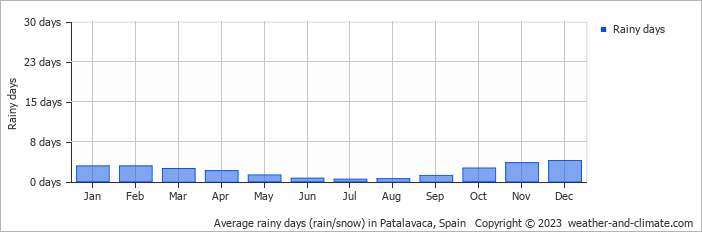
Patalavaca sits in an arid zone with minimal moisture, averaging 169 mm of rainfall per year. The seasons in Patalavaca, bring significant changes in precipitation. The wettest month, December, receives moderate rainfall, with an average of 34 mm of precipitation. This rainfall is distributed across 4 rainy days. In contrast, the driest month, July, experiences much less rainfall, totaling 0.9 mm over 0 rainy days. These distinct seasonal differences provide diverse experiences throughout the year. For more details, please visit our Patalavaca Precipitation page.The mean monthly precipitation over the year, including rain, hail and snow
The average number of days each month with precipitation
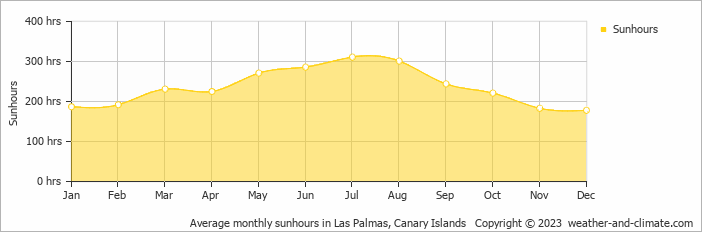
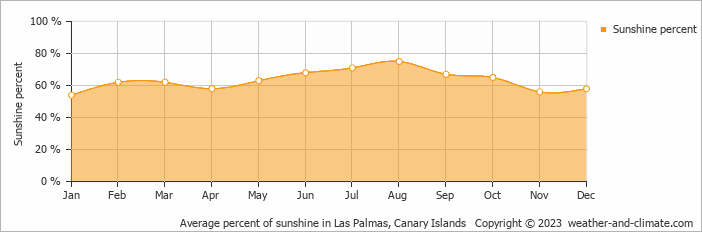
Sunshine over the year
In Patalavaca, summer days are longer and more sunny, with daily sunshine hours peaking at 10.4 hours in July. As the darker season arrives, the brightness of the sun becomes less. December sees a soft sun for only 5.9 hours per average day. Visit our detailed sunshine hours page for more information.Monthly hours of sunshine
Daily hours of sunshine
Daily percentage of sunshine
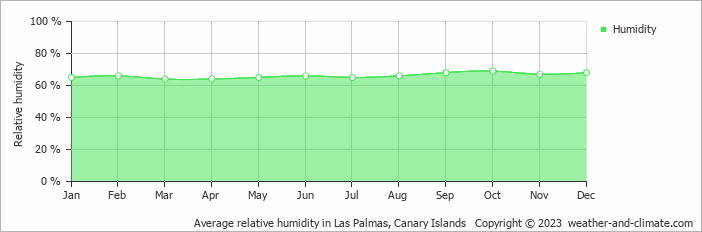
Average humidity
The relative humidity is high throughout the year in Patalavaca.
The city experiences its highest humidity in October, reaching 69%. In March, the humidity drops to its lowest level at 64%. Explore our detailed page on humidity levels for further details.
Relative humidity over the year
partly cloudy and chance of slight rain partly cloudy and chance of slight rain clear and no rainForecast for Patalavaca
 5 m/s
5 m/s![]() 6 m/s
6 m/s![]() 6 m/s
6 m/s![]()
The best time of year to visit Patalavaca in Spain
During the months of March, April, May, June, July, August, September, October, November and December you are most likely to experience good weather with pleasant average temperatures that fall between 20°C and 26°C.Other facts from our historical weather data:
The hottest season / summer takes place in July, August, September and October.
August has an average maximum temperature of 26°C and is the warmest month of the year.
The coldest month is February with an average maximum temperature of 19°C.
December tops the wettest month list with 34 mm of rainfall.
July is the driest month with 1 mm of precipitation.
July is the sunniest month with an average of 311 hours of sunshine.
No idea where to travel to this year? We have a tool that recommends destinations based on your ideal conditions. Find out where to go with our weather planner.


