Palenque Weather and Climate: A Comprehensive Guide
The temperature in Palenque varies moderately throughout the year.
The temperatures shift from very hot
to warm.
It also experiences much rainfall throughout the year.
Now, let’s break down all the climate details for a clearer picture.
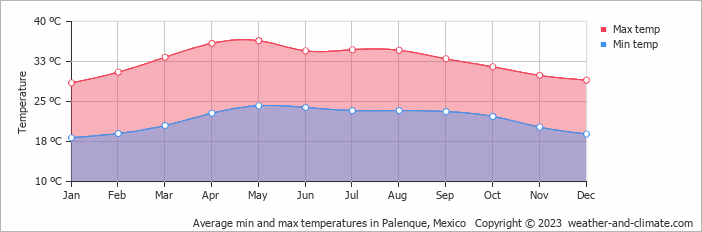
Average maximum day and minimum night temperature
The climate in Palenque experiences moderate temperature changes, with mild shifts between seasons. Average daytime temperatures reach a very hot 36°C in May. In January, the coolest month of the year, temperatures drop to a comfortable 29°C.
At night, you can expect cooler temperatures, with averages dropping to around 18°C during this month. Check out our detailed temperature page for more information.Temperature ranges by month
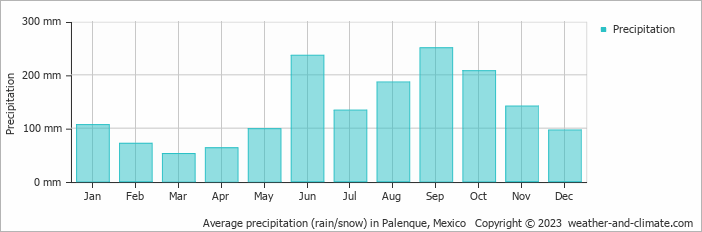
Precipitation and rainy days
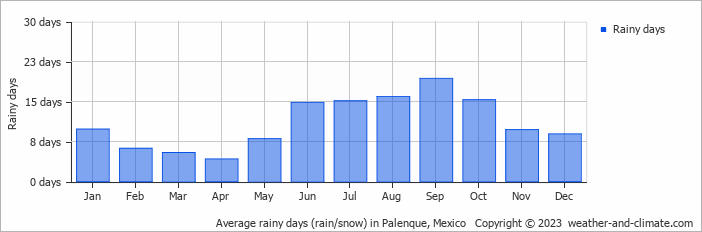
Palenque has a relatively rainy climate with high precipitation levels, averaging 1643 mm of rainfall annually. Palenque can be quite wet during September, receiving approximately 250 mm of precipitation over 19 rainy days. In contrast March, experiences much drier conditions, with 52 mm of rainfall, spread across 5 rainy days. For more details, please visit our Palenque Precipitation page.The mean monthly precipitation over the year, including rain, hail and snow
The average number of days each month with precipitation
almost clear and no rain clear and small chance of slight rain partly cloudy and rainForecast for Palenque
 3 m/s
3 m/s![]() 3 m/s
3 m/s![]() 1 m/s
1 m/s![]()
Select a Month of Interest
Check the conditions for any month of the year.
The best time of year to visit Palenque in Mexico
Other facts from our historical weather data:Rainy season in Palenque occurs in the months of June, August, September and October.
May has an average maximum temperature of 36°C and is the hottest month of the year.
The coolest month is January with an average maximum temperature of 29°C.
September tops the wettest month list with 250 mm of rainfall.
March is the driest month with 52 mm of precipitation.
No idea where to travel to this year? We have a tool that recommends destinations based on your ideal conditions. Find out where to go with our weather planner.


