Oyster Pond Weather & Climate: Best Time to Visit
Average temperatures, rainfall, sunshine and the best time to visit Oyster Pond.
Climate overview of Oyster Pond
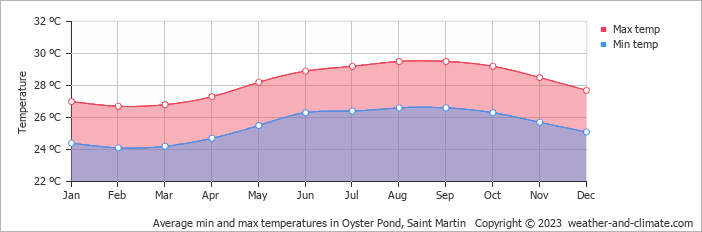
Oyster Pond, Saint Martin, has a stable climate with little temperature variation across the year. Average daytime temperatures hover around 28°C (82°F), peaking in August at 30°C (86°F) and dipping in February to 27°C (81°F).
The city receives around 917 mm (36 in) of rainfall per year. It experiences a distinct dry season from February to March. October is the wettest month and March the driest. The most sunshine falls in August, with an average of 9.5 hours of daily sunshine.
Oyster Pond Weather by Month
Pick a month to see the average temperature, rainfall and sunshine in Oyster Pond - and find the best time to visit.


Monthly Temperature in Oyster Pond
With minimal seasonal shifts, Oyster Pond experiences a constant climate year-round. On average, daytime temperatures range from a comfortable 30°C (86°F) in August to a comfortable 27°C (81°F) in February.
Nighttime temperatures range from 27°C (81°F) in August to 24°C (75°F) in February.
Check out our detailed temperature page for more information.
Temperature ranges by month
Rainfall in Oyster Pond
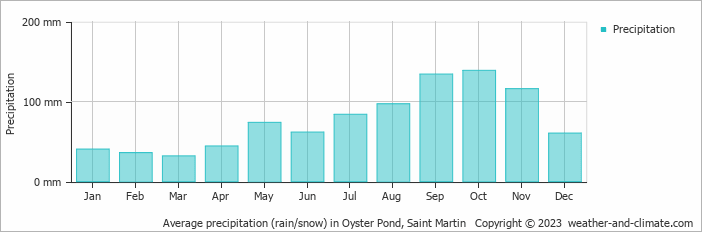
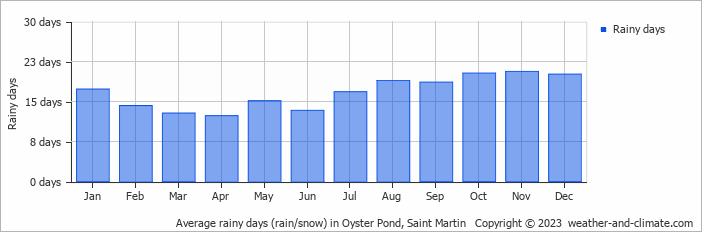
Generally, Oyster Pond receives mid-range precipitation levels, with 917 mm (36 in) annually. The seasons in Oyster Pond bring significant changes in precipitation. The wettest month, October, receives high rainfall, with an average of 139 mm (5.5 in) of precipitation. This rainfall is distributed across 20 rainy days.
In contrast, the driest month, March, experiences much less rainfall, totaling 32 mm (1.3 in) over 13 rainy days. These distinct seasonal differences provide diverse experiences throughout the year. For more details, please visit our Oyster Pond Precipitation page.
The mean monthly precipitation over the year, including rain, hail, and snow
The average number of days each month with precipitation
Sunshine Hours in Oyster Pond
The sunniest days in Oyster Pond occur in August, with around 9.5 hours of daily sunshine. Even in September, the least sunny month, Oyster Pond doesn't shy away from the sun, still enjoying a comfortable 7.7 hours of daily sunlight.
Visit our detailed sunshine hours page for more information.
Monthly hours of sunshine
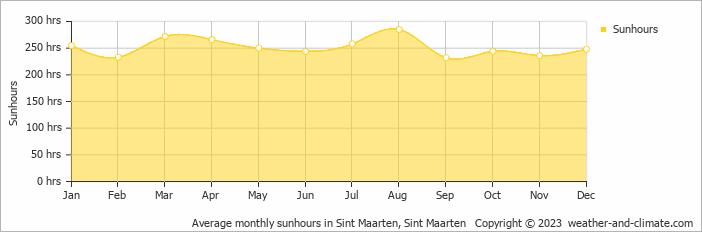
Daily hours of sunshine
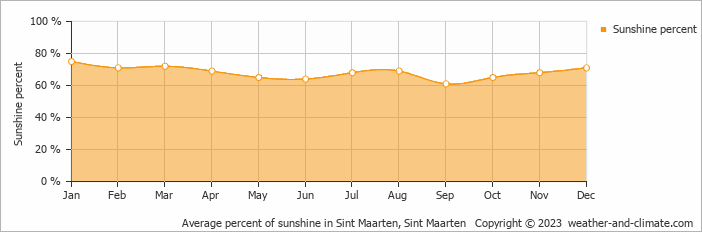
Daily percentage of sunshine
Water Temperature in Oyster Pond
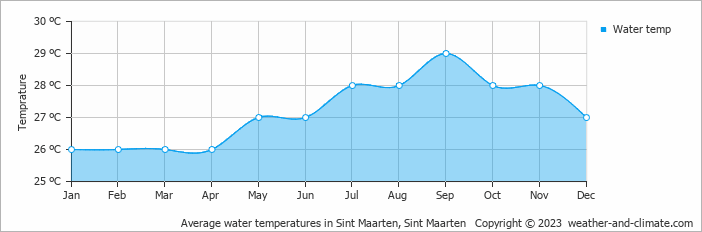
The mean water temperature over the year ranges from 26°C (79°F) in January to 29°C (84°F) in September.
Water temperature over the year
Humidity in Oyster Pond by Month
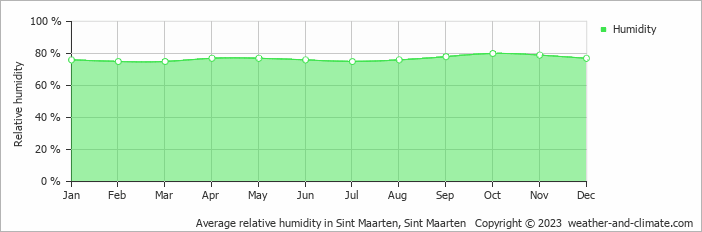
The relative humidity is high throughout the year in Oyster Pond.
The city experiences its highest humidity in October, reaching 80%. In February, the humidity drops to its lowest level at 75%. What does this mean? Read our detailed page on humidity levels for further details.
Relative humidity over the year
Wind Speed in Oyster Pond
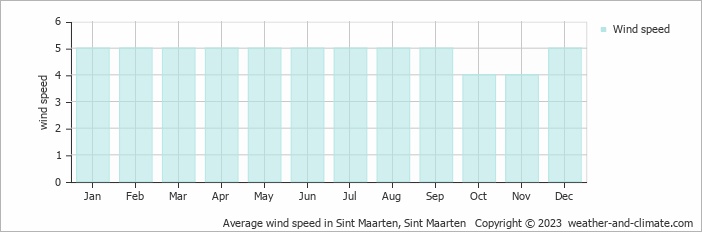
The mean wind speed varies between 4 m/s (8 knots) and 5 m/s (10 knots) throughout the year. It is lowest in October and November and highest during January, February, March, April, May, June, July, August, September and December. What does this mean?
The mean monthly wind speed over the year (meters per second)
Best Time to Visit Oyster Pond
Monthly ratings reflect general weather comfort, based on daytime temperature and rainfall. Swimming and winter conditions are highlighted separately where relevant.
- Best overall: January, February, March, April, May, June, July and December
- Warmest weather: May, June, July, August, September, October and November
- Most sunshine: March and August
- Fewer rainy days: February, March, April, May and June
- Best for swimming: Any time of year. The sea stays pleasantly warm year-round.
- Wettest months: July, August, September, October and November, when rainfall is highest.
- Seasonal pattern: A distinct dry season from February to March
Frequently asked questions about the climate in Oyster Pond
What is the best time to visit Oyster Pond?
January, February, March, April, May, June, July and December typically offer the most optimal weather in Oyster Pond. In contrast, September tends to have less optimal conditions. Oyster Pond has a distinct dry season from February to March.
What temperatures can I expect in Oyster Pond?
Daytime highs range from 27°C (81°F) in February to 30°C (86°F) in August. Nighttime lows range from 24°C (75°F) to 27°C (81°F). Temperatures stay relatively stable year-round.
How much rain does Oyster Pond get?
Annual rainfall is around 917 mm (36 in). October is the wettest month with 139 mm (5.5 in), while March is the driest with 32 mm (1.3 in).
How sunny is Oyster Pond?
Oyster Pond receives around 3,023 hours of sunshine per year. August is the sunniest month with 285 hours, while September is the cloudiest with just 232 hours. Overall, Oyster Pond enjoys abundant sunshine.
Oyster Pond 3-Day Forecast
Oyster Pond on the map
Oyster Pond is highlighted - select any city to see its climate.
Popular this month
Where to go in September - average daytime high across popular destinations.
 Baie Longue
 30°C (86°F) Cul de Sac30°C (86°F) Marigot30°C (86°F) Grand Case30°C (86°F) Orient Bay French St Martin30°C (86°F) Les Terres Basses30°C (86°F) Baie Nettle30°C (86°F) Orient Bay30°C (86°F)













