

















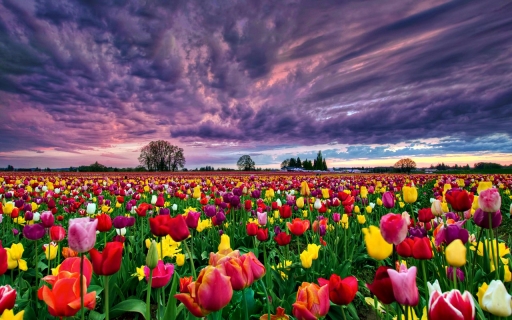
 Flower fields in the Netherlands
The flower fields in The Netherlands are world famous. The red, pink and yellow colors are breathtakingly beautiful and should be on the bucket list.
Average temperatures, rainfall, sunshine and the best time to visit Ouddorp.
 –
–
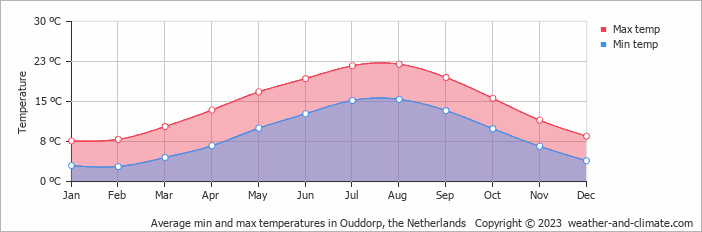
Ouddorp, Zeeland, Netherlands, sees big temperature differences between seasons, with August peaking at 22°C (72°F) and January dropping to 8°C (46°F).
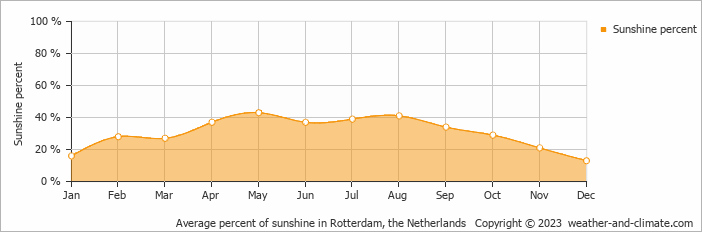
Ouddorp sees a moderate amount of rain/snowfall, totalling around 914 mm (36 in) per year. It experiences warm summers and cold winters, creating some seasonal variation. The sunniest month is May, with 7.6 hours of sunshine per day on average.
Pick a month to see the average temperature, rainfall and sunshine in Ouddorp - and find the best time to visit.
Visitors to Ouddorp can expect significant temperature changes throughout the year. Average maximum daytime temperatures range from a comfortable 22°C (72°F) in August, the warmest time of the year, to a chilly 8°C (46°F) during cooler months like January.
At night, you can expect temperatures ranging from 15°C (59°F) in August to around 3°C (37°F) during January.
Check out our detailed temperature page for more information.
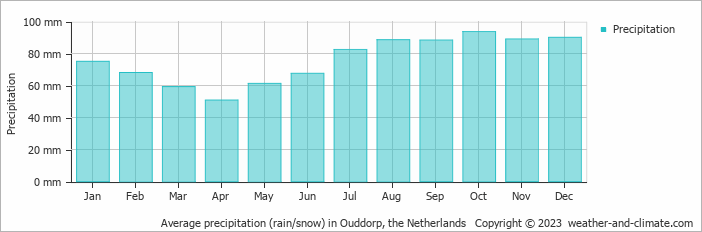
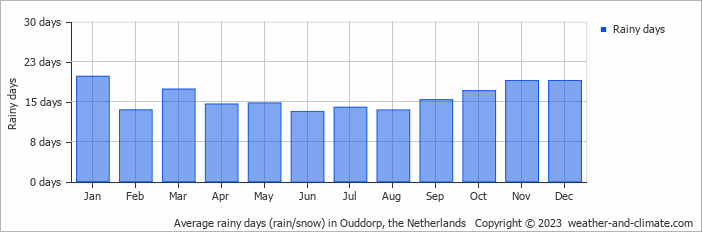
Generally, Ouddorp experiences moderate precipitation patterns, averaging 914 mm (36 in) yearly. While rainfall varies throughout the year, each season offers its own charm. October brings wetter days averaging 94 mm (3.7 in) of precipitation, spread over 17 rainy days.
In contrast, the driest month April experiences a drier climate, with about 51 mm (2 in) of rainfall spread across 15 rainy days. For more details, please visit our Ouddorp Precipitation page.
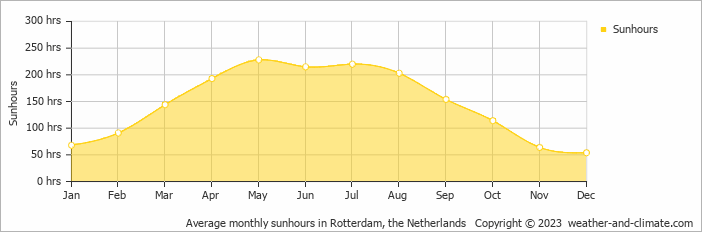
Seasonal changes in sunshine hours are quite dramatic in Ouddorp. While May receives considerable daily sunshine with up to 7.6 hours, December marks the darkest time of the year, where sunshine is scarce with only 1.8 hours of sunlight per day.
Visit our detailed sunshine hours page for more information.
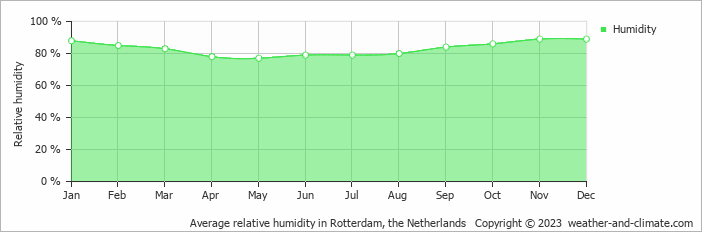
The city experiences its highest humidity in November, reaching 89%. In May, the humidity drops to its lowest level at 77%. What does this mean? Read our detailed page on humidity levels for further details.
Monthly ratings reflect general weather comfort, based on daytime temperature and rainfall. Swimming and winter conditions are highlighted separately where relevant.
July, August and September typically offer the most optimal weather in Ouddorp. In contrast, January, February, March and December tend to have less optimal conditions. Ouddorp has warm summers and cold winters.
Daytime highs range from 8°C (46°F) in January to 22°C (72°F) in August. Nighttime lows range from 3°C (37°F) to 15°C (59°F). Temperatures vary considerably through the year.
Annual rainfall is around 914 mm (36 in). October is the wettest month with 94 mm (3.7 in), while April is the driest with 51 mm (2 in).
Ouddorp receives around 1,748 hours of sunshine per year. May is the sunniest month with 228 hours, while December is the cloudiest with just 54 hours.
Ouddorp is highlighted - select any city to see its climate.
Where to go in September - average daytime high across popular destinations.
Valkenburg 20°C (68°F) Utrecht20°C (68°F) Maastricht20°C (68°F) Noordwijk aan Zee
 19°C (66°F) Rotterdam20°C (68°F) Zandvoort19°C (66°F) The Hague20°C (68°F) Amsterdam19°C (66°F)
 Need travel inspiration? Check out our bucket list articles and be inspired.
Flower fields in the Netherlands
The flower fields in The Netherlands are world famous. The red, pink and yellow colors are breathtakingly beautiful and should be on the bucket list.
 Pride in Amsterdam
Nowhere in the world is Pride being celebrated on the water on such a scale as in Amsterdam. It is an unique experience that every person needs to add to his, her or its bucket list.
 The greenest experience of Amsterdam
If you’re looking for an experience of Amsterdam that is rooted in nature, that can help you go outside and get your hands dirty, then these tips are for you.
 Amsterdam Dance Event
ADE is one of the larger festival giants, but you may never have heard of it if you are not an electronic music fan. It last five days and takes place in October.