
















 The 10 most alternative cities in South America
Discover South America's top 10 alternative cities! From Valparaíso's vibrant streets to La Paz's high-altitude charm and Medellín's innovative spirit.
Average temperatures, rainfall, sunshine and the best time to visit Olón.
 –
–
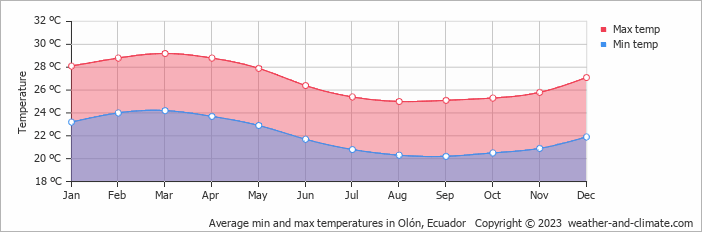
With consistently stable weather, Olón, Ecuador, sees little seasonal temperature change. Daytime highs average 27°C (81°F), ranging from 29°C (84°F) in March to 25°C (77°F) in August.
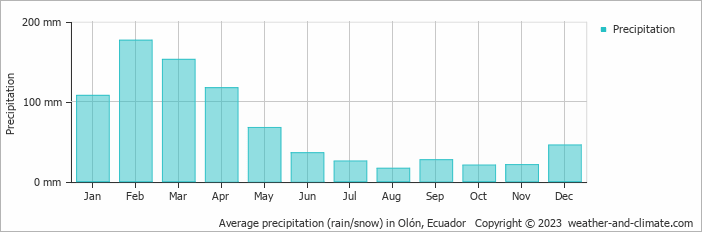
Olón sees a moderate amount of rainfall, totalling around 812 mm (32 in) per year. It experiences a distinct dry season from June to November, creating some seasonal variation.
Pick a month to see the average temperature, rainfall and sunshine in Olón - and find the best time to visit.
The climate in Olón remains fairly constant, offering comfortable temperatures throughout the year. Average maximum daytime temperatures range from a comfortable 29°C (84°F) in March, the warmest time of the year, to a comfortable 25°C (77°F) during cooler months like August.
At night, you can expect temperatures ranging from 24°C (75°F) in March to around 20°C (68°F) during August.
Check out our detailed temperature page for more information.
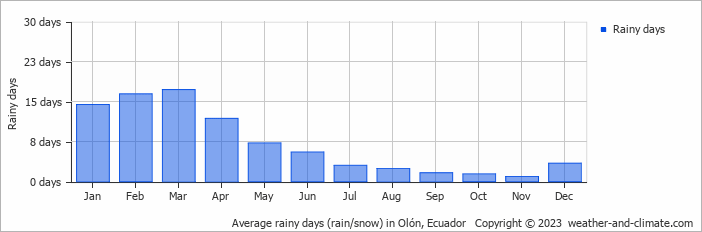
Generally, Olón experiences moderate precipitation patterns, averaging 812 mm (32 in) yearly. Significant seasonal changes in precipitation occur throughout the year. In the wettest month, February it receives heavy rainfall, averaging 177 mm (7 in) of precipitation, recorded across 16 rainy days. In contrast, the driest month August brings less rainfall, with 16 mm (0.6 in) over 2 rainy days. For more details, please visit our Olón Precipitation page.
Monthly ratings reflect general weather comfort, based on daytime temperature and rainfall. Swimming and winter conditions are highlighted separately where relevant.
May, June, July, August, September, October, November and December typically offer the most optimal weather in Olón. In contrast, January, February, March and April tend to have less optimal conditions. Olón has a distinct dry season from June to November.
Daytime highs range from 25°C (77°F) in August to 29°C (84°F) in March. Nighttime lows range from 20°C (68°F) to 24°C (75°F). Temperatures stay relatively stable year-round.
Annual rainfall is around 812 mm (32 in). February is the wettest month with 177 mm (7 in), while August is the driest with 16 mm (0.6 in).
Olón is highlighted - select any city to see its climate.
Where to go in September - average daytime high across popular destinations.
 Guayaquil
 29°C (84°F) Montañita25°C (77°F) Puerto Ayora26°C (79°F) Salinas23°C (73°F) Puerto Baquerizo Moreno
 23°C (73°F) Quito
 19°C (66°F) Baños17°C (63°F) Cuenca15°C (59°F)
 Need travel inspiration? Check out our bucket list articles and be inspired.
The 10 most alternative cities in South America
Discover South America's top 10 alternative cities! From Valparaíso's vibrant streets to La Paz's high-altitude charm and Medellín's innovative spirit.
 The Galapagos Islands
The Galapagos Islands is one of the most beautiful places on earth. If you want to see the origins of our planet with your own eyes, you should travel here.
 A rain forest hotel in the clouds
This is not "just a lodge". It is a sanctuary of peace and nature for those who like to stay in the heart of nature with minimal environmental impact.

 Visit the Rainbow Mountains
The Rainbow Mountain (Vinicunca) is acolored rainbow mountain that will steal your heart forever and the view from the top will take your breath away.