Oberried Weather & Climate: Best Time to Visit
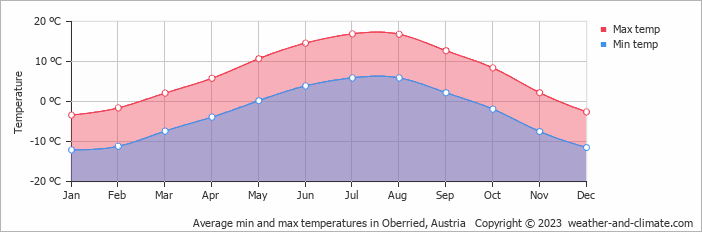
The climate in Oberried, Tyrol, Austria, is marked by large temperature swings across the seasons, ranging from 17°C (63°F) in July to -3°C (27°F) in January.
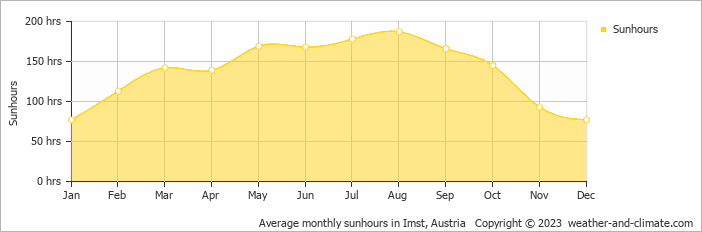
The city has a wet climate, receiving around 1570 mm (62 in) of rain/snowfall per year. Despite the high annual total, it has a distinct rainy season from June to August. July is the wettest month. Sunshine peaks in August, when the city sees around 6.2 hours of sunshine per day.
Monthly Temperature in Oberried
In Oberried, temperatures differ significantly between summer and winter months. On average, daytime temperatures range from a moderate 17°C (63°F) in July to a very cold -3°C (27°F) in January.
Nighttime temperatures range from 6°C (43°F) in July to -12°C (10°F) in January.
Check out our detailed temperature page for more information.
Temperature ranges by month
Rainfall in Oberried
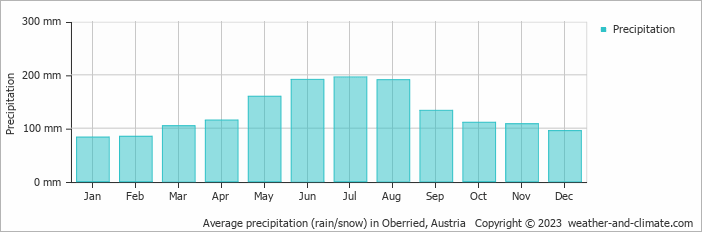
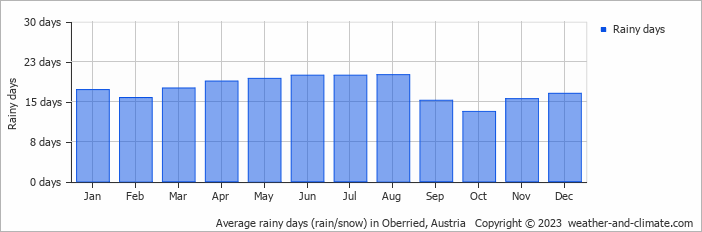
Oberried experiences significant rain/snowfall throughout the year, averaging 1570 mm (62 in) of precipitation annually. The seasons in Oberried bring significant changes in precipitation. The wettest month, July, receives heavy rainfall, with an average of 196 mm (7.7 in) of precipitation. This rainfall is distributed across 20 rainy days.
In contrast, the driest month, January, experiences much less snowfall, totaling 83 mm (3.3 in) over 17 snowy days. These distinct seasonal differences provide diverse experiences throughout the year. For more details, please visit our Oberried Precipitation page.
The mean monthly precipitation over the year, including rain, hail, and snow
The average number of days each month with precipitation
Sunshine Hours in Oberried
In Oberried, summer days are longer and more sunny, with daily sunshine hours peaking at 6.2 hours in August. As the darker season arrives, the brightness of the sun becomes less. January sees a soft sun for only 2.6 hours per average day.
Visit our detailed sunshine hours page for more information.
Monthly hours of sunshine
Daily hours of sunshine
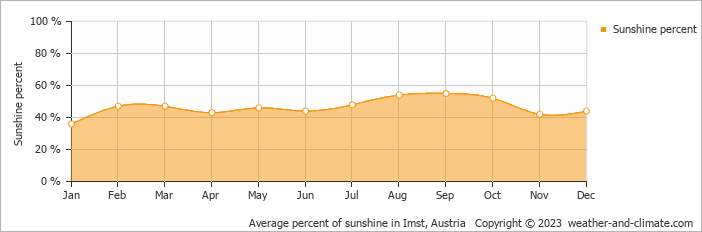
Daily percentage of sunshine
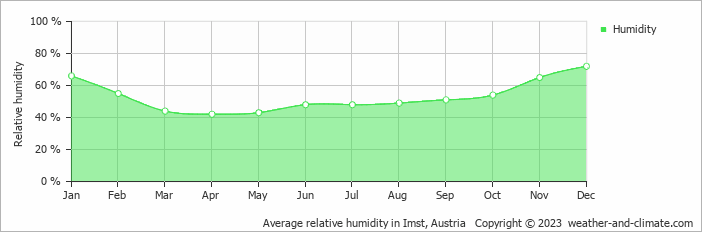
Humidity in Oberried by Month
The relative humidity is moderate throughout the year in Oberried.
The city experiences its highest humidity in December, reaching 72%. In April, the humidity drops to its lowest level at 42%. What does this mean? Read our detailed page on humidity levels for further details.
Relative humidity over the year
Oberried 3-Day Forecast
Check the conditions for any month of the year.
Best Time to Visit Oberried
The best time to visit Oberried is during July and August, when the weather provides comfortable temperatures between 17°C (62°F) and 17°C (62°F). With rainfall of 191 mm (7.5 in) to 196 mm (7.7 in), you can expect pleasant weather during your visit in these months.Be prepared for heavier rainfall during June, July and August, the wettest period of the year. Seeking the perfect travel destination for this year? We've created a tool that suggests locations matching your desired weather. Let our weather planner guide your travel decisions.