Mošćenička Draga Weather and Climate: A Comprehensive Guide
Mošćenička Draga experiences great temperature shifts.
The city's weather can transition from warm days
to cold weather.
It also has a relatively rain/snowy climate with high levels of precipitation.
Let's now guide you through the climate details for a complete overview.
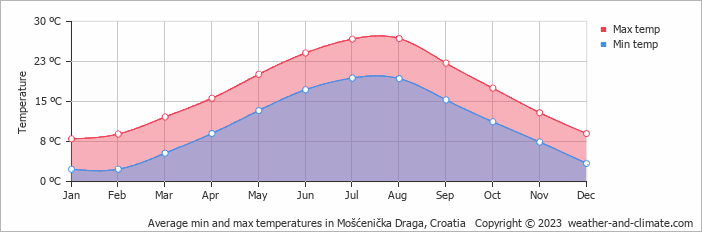
Average maximum day and minimum night temperature
The climate in Mošćenička Draga is known for significant temperature differences throughout the year, making the weather dynamic. On average, daytime temperatures range from a comfortable 27°C in August to a chilly 8°C in January.
Nighttime temperatures can drop, with average lows reaching 2°C in January. Check out our detailed temperature page for more information.Temperature ranges by month
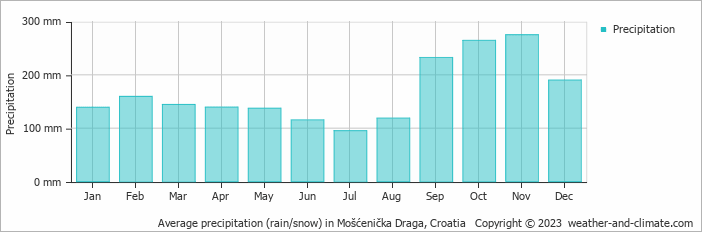
Precipitation and rainy days
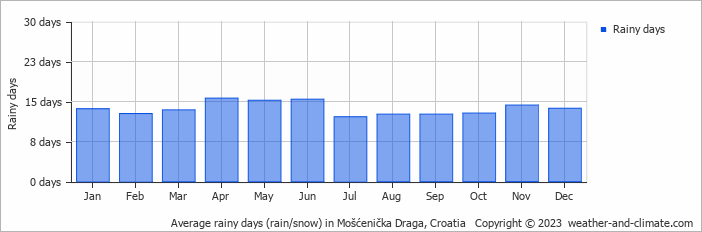
Mošćenička Draga has a notably wet climate with abundant precipitation, recording 2009 mm of rain/snowfall per year. The seasons in Mošćenička Draga, bring significant changes in precipitation. The wettest month, November, receives heavy rainfall, with an average of 275 mm of precipitation. This rainfall is distributed across 14 rainy days. In contrast, the driest month, July, experiences much less rainfall, totaling 95 mm over 12 rainy days. These distinct seasonal differences provide diverse experiences throughout the year. For more details, please visit our Mošćenička Draga Precipitation page.The mean monthly precipitation over the year, including rain, hail and snow
The average number of days each month with precipitation
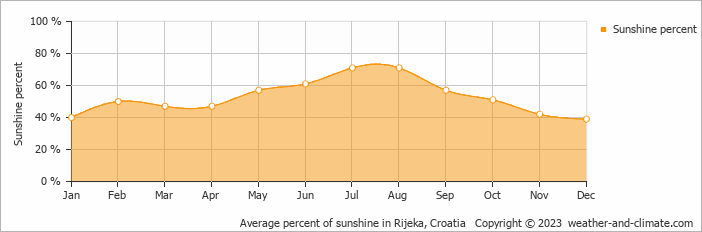
Sunshine over the year
In Mošćenička Draga, summer days are longer and more sunny, with daily sunshine hours peaking at 9.9 hours in July. As the darker season arrives, the brightness of the sun becomes less. December sees a soft sun for only 3.3 hours per average day. Visit our detailed sunshine hours page for more information.Monthly hours of sunshine
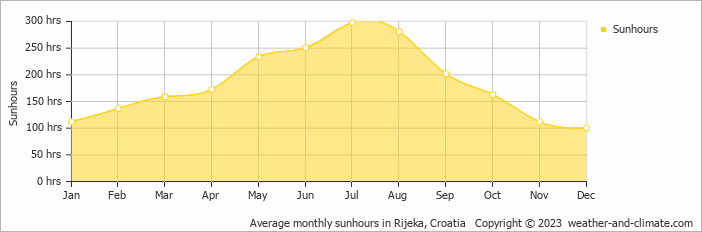
Daily hours of sunshine
Daily percentage of sunshine
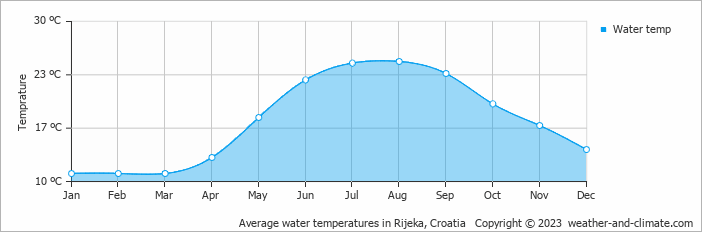
Average water temperature
The mean water temperature over the year ranges from 11°C in January to 25°C in August.
Water temperature over the year
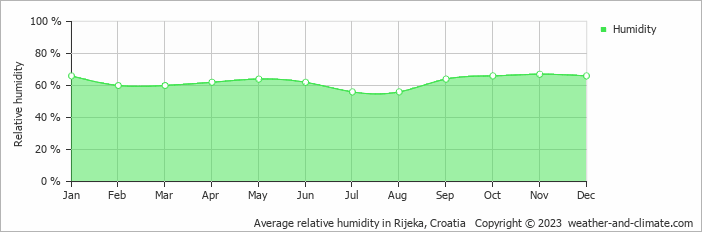
Average humidity
The relative humidity is high throughout the year in Mošćenička Draga.
The city experiences its highest humidity in November, reaching 67%. In July, the humidity drops to its lowest level at 56%. What does this mean? Read our detailed page on humidity levels for further details.
Relative humidity over the year
broken clouds and rain overcast and heavy rain overcast and chance of slight rainForecast for Mošćenička Draga
 6 m/s
6 m/s![]() 4 m/s
4 m/s![]() 5 m/s
5 m/s![]()
Select a Month of Interest
Check the weather conditions for any month in Mošćenička Draga.
The best time of year to visit Mošćenička Draga in Croatia
During the months of May, June and September you are most likely to experience good weather with pleasant average temperatures that fall between 20°C and 26°C.Other facts from our historical weather data:
Rainy season in Mošćenička Draga occurs in the months of February, September, October, November and December.
August has an average maximum temperature of 27°C and is the warmest month of the year.
The coldest month is January with an average maximum temperature of 8°C.
November tops the wettest month list with 275 mm of rainfall.
July is the driest month with 95 mm of precipitation.
July is the sunniest month with an average of 298 hours of sunshine.
No idea where to travel to this year? We have a tool that recommends destinations based on your ideal conditions. Find out where to go with our weather planner.


