Minca Weather & Climate: Best Time to Visit
Average temperatures, rainfall, sunshine and the best time to visit Minca.
Climate overview of Minca
The climate in Minca, Magdalena, Colombia, is remarkably consistent, with temperatures year-round averaging 28°C (82°F). The warmest month is June at 28°C (82°F), and the coolest is January at 27°C (81°F).
The city receives considerable rainfall, with around 2627 mm (103 in) annually. October is the wettest month. It has a distinct rainy season from May to November. The sunniest month is January, with 9.5 hours of sunshine per day on average.
Minca Weather by Month
Pick a month to see the average temperature, rainfall and sunshine in Minca — and find the best time to visit.
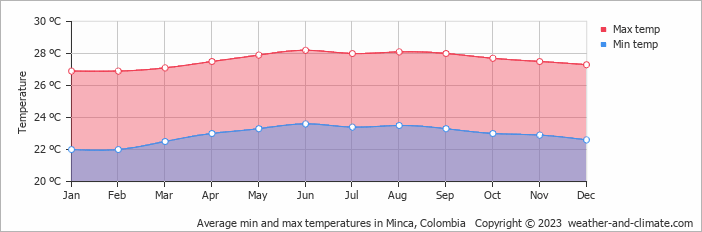
Monthly Temperature in Minca
In Minca temperatures are generally consistent throughout the year. Typically, average maximum daytime temperatures range from a comfortable 28°C (82°F) in June to a comfortable 27°C (81°F) in the coolest month, January.
Nights vary from 24°C (75°F) in June to around 22°C (72°F) during the colder months.
Check out our detailed temperature page for more information.
Temperature ranges by month
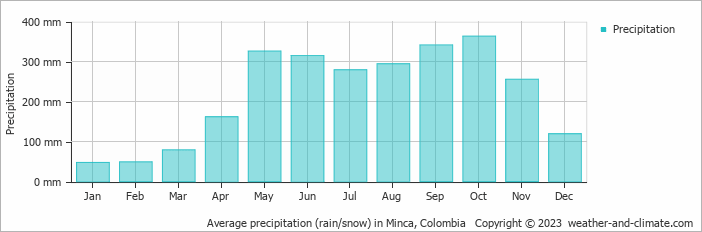
Rainfall in Minca
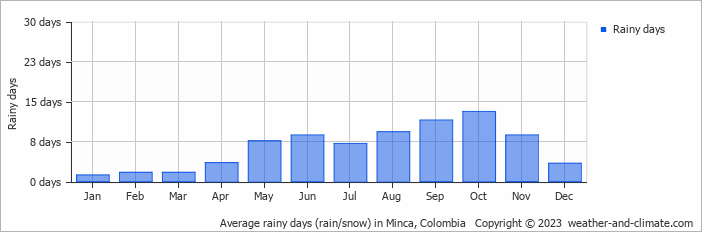
Minca experiences significant rainfall throughout the year, averaging 2627 mm (103 in) of precipitation annually. The climate in Minca shows significant variation throughout the year. Expect heavy rainfall in October, the wettest month, with an average of 363 mm (14 in) of precipitation over 13 rainy days.
In contrast, the driest month January offers drier and sunnier days, with around 47 mm (1.9 in) of rainfall over a single rainy day. For more details, please visit our Minca Precipitation page.
The mean monthly precipitation over the year, including rain, hail, and snow
The average number of days each month with precipitation
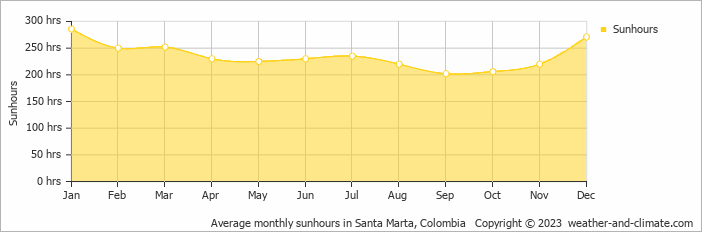
Sunshine Hours in Minca
Minca offers a pleasant mix of sunny and slightly overcast days. The difference in sunshine hours between January (9.5 hours daily) and September (6.7 hours daily) provides a bit of variety for visitors and residents.
Visit our detailed sunshine hours page for more information.
Monthly hours of sunshine
Daily hours of sunshine
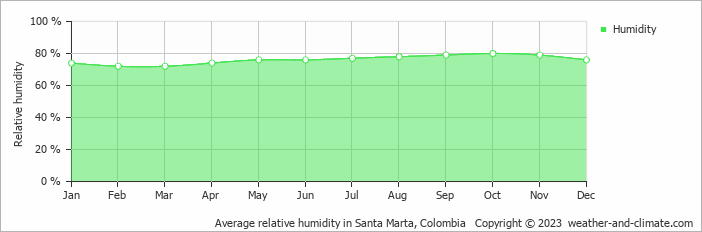
Humidity in Minca by Month
The relative humidity is high throughout the year in Minca.
The city experiences its highest humidity in October, reaching 80%. In February, the humidity drops to its lowest level at 72%. What does this mean? Read our detailed page on humidity levels for further details.
Relative humidity over the year
Best Time to Visit Minca
To make the most of your visit, consider exploring early in the morning or during the pleasant late afternoon hours when the temperature is most comfortable.
Be aware that April, May, June, July, August, September, October and November constitute the rainy season, with significant precipitation. Wondering where to travel based on your weather preferences? Our recommendation tool helps you find destinations with your ideal climate conditions. Use our weather planner to find your perfect destination.
Frequently asked questions about the climate in Minca
What is the best time to visit Minca?
January, February and March typically offer the most optimal weather in Minca. In contrast, May, June, July, August, September and October tend to have less optimal conditions. Minca has a distinct rainy season from May to November.
What temperatures can I expect in Minca?
Daytime highs range from 27°C (81°F) in January to 28°C (82°F) in June. Nighttime lows range from 22°C (72°F) to 24°C (75°F). Temperatures stay relatively stable year-round.
How much rain does Minca get?
Annual rainfall is around 2627 mm (103 in). October is the wettest month with 363 mm (14 in), while January is the driest with 47 mm (1.9 in).
How sunny is Minca?
Minca receives around 2,827 hours of sunshine per year. January is the sunniest month with 286 hours, while September is the cloudiest with just 202 hours. Overall, Minca enjoys abundant sunshine.
Minca 3-Day Forecast
Minca 3-Day Forecast
Minca on the map
Minca is highlighted — select any city to see its climate.
Popular this month
Where to go in June — average daytime high across popular destinations.
Bucket list
Need travel inspiration? Check out our bucket list articles and be inspired.
 Breathtaking view in Minca
Minca is a tiny village in the tropical rain forest of Colombia and is an oasis of tranquility. Everyone looking for a relatively undiscovered piece of Colombia is in the right place here.
5 Hidden Gems in Colombia
Explore Colombia's hidden gems, from El Cocuy's remote beauty to Providencia's serene beaches, offering authentic experiences off the beaten path.
Tayrona National Park: the most beautiful part of Colombia
Visit the park between the months December and March (not February since it is closed) or from June till August (this is high season).
Breathtaking view in Minca
Minca is a tiny village in the tropical rain forest of Colombia and is an oasis of tranquility. Everyone looking for a relatively undiscovered piece of Colombia is in the right place here.