Mayaguez Weather & Climate: Best Time to Visit
Average temperatures, rainfall, sunshine and the best time to visit Mayaguez.
Climate overview of Mayaguez
Mayaguez, Central Puerto Rico, Puerto Rico, enjoys a steady climate throughout the year, with daytime temperatures typically around 30°C (86°F). July is the warmest month at 31°C (88°F), while February is the coolest at 28°C (82°F).
Annual rainfall is moderate at around 794 mm (31 in), with September being the wettest month. The city also has a distinct dry season from December to February.
Mayaguez Weather by Month
Pick a month to see the average temperature, rainfall and sunshine in Mayaguez - and find the best time to visit.
Monthly Temperature in Mayaguez
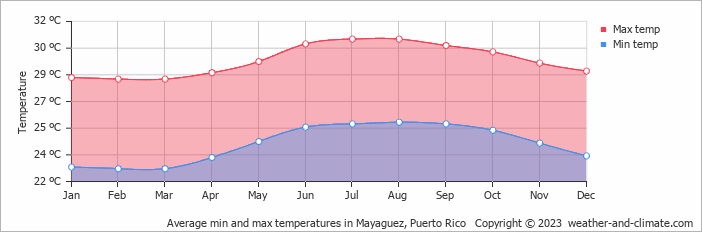
The temperature in Mayaguez remains steady throughout the year, providing a consistently very warm climate. Average daytime temperatures reach a very warm 31°C (88°F) in July. In February, the coolest month of the year, temperatures drop to a comfortable 28°C (82°F).
At night, temperatures range from around 26°C (79°F) in July to 23°C (73°F) in February.
Check out our detailed temperature page for more information.
Temperature ranges by month
Rainfall in Mayaguez
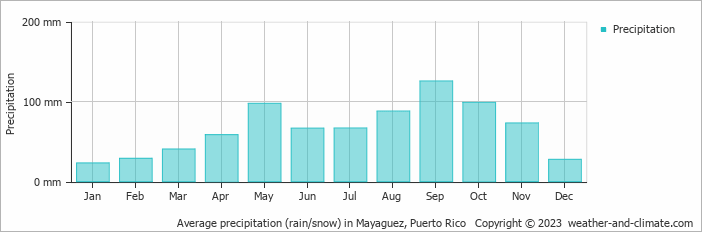
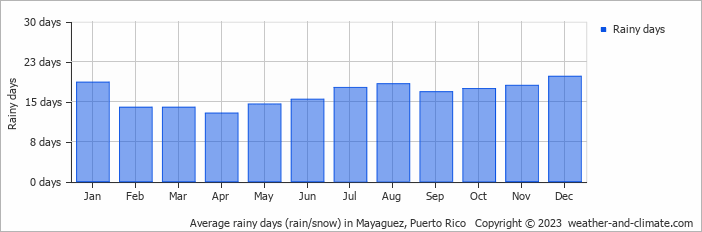
Generally, Mayaguez has a moderate amount of precipitation, averaging 794 mm (31 in) of rainfall annually. Mayaguez can be quite wet during September, receiving approximately 126 mm (5 in) of precipitation over 17 rainy days.
In contrast, during the driest month (January), you will experience much drier conditions, with 23 mm (0.9 in) of precipitation spread across 19 rainy days. For more details, please visit our Mayaguez Precipitation page.
The mean monthly precipitation over the year, including rain, hail, and snow
The average number of days each month with precipitation
Best Time to Visit Mayaguez
Monthly ratings reflect general weather comfort, based on daytime temperature and rainfall. Swimming and winter conditions are highlighted separately where relevant.
- Best overall: January, February, March, April, November and December
- Warmest weather: May, June, July, August, September, October and November
- Fewer rainy days: February, March, April, May and June
- Seasonal pattern: A distinct dry season from December to February
Frequently asked questions about the climate in Mayaguez
What is the best time to visit Mayaguez?
January, February, March, April, November and December typically offer the most optimal weather in Mayaguez. In contrast, September tends to have less optimal conditions. Mayaguez has a distinct dry season from December to February.
What temperatures can I expect in Mayaguez?
Daytime highs range from 28°C (82°F) in February to 31°C (88°F) in July. Nighttime lows range from 23°C (73°F) to 26°C (79°F). Temperatures stay relatively stable year-round.
How much rain does Mayaguez get?
Annual rainfall is around 794 mm (31 in). September is the wettest month with 126 mm (5 in), while January is the driest with 23 mm (0.9 in).
Mayaguez 3-Day Forecast
Mayaguez on the map
Mayaguez is highlighted - select any city to see its climate.
Popular this month
Where to go in July - average daytime high across popular destinations.