















 The 10 most alternative cities in South America
Discover South America's top 10 alternative cities! From Valparaíso's vibrant streets to La Paz's high-altitude charm and Medellín's innovative spirit.
Average temperatures, rainfall, sunshine and the best time to visit Mamiña.
 –
10-day forecastForecast
–
10-day forecastForecast
Mamiña, in Chile's Tarapacá region, maintains a steady average temperature throughout the year with consistent conditions. The area sits in an arid zone with minimal rainfall year-round. People come to Mamiña to bath in the famous natural hot springs and enjoy the therapeutic thermal baths at this high-altitude desert oasis. Let's explore the climate details to provide you with a complete overview on when to visit.
Pick a month to see the average temperature, rainfall and sunshine in Mamiña - and find the best time to visit.
The temperature in Mamiña remains steady throughout the year, providing a consistently pleasant climate. Average daytime temperatures reach a pleasant 21°C (70°F) in October. In February, the coolest month of the year, temperatures drop to a pleasant 18°C (64°F).
At night, temperatures range from around 10°C (50°F) in October to 6°C (43°F) in February.
Check out our detailed temperature page for more information.

Mamiña has a dry climate with very low precipitation, averaging 240 mm (9.4 in) of rainfall annually. Mamiña can be quite wet during February, receiving approximately 90 mm (3.5 in) of precipitation over 12 rainy days.
In contrast, during the driest month (May), you will experience much drier conditions, with 1 mm (0.04 in) of precipitation spread across 0 rainy days. For more details, please visit our Mamiña Precipitation page.


Monthly ratings reflect general weather comfort, based on daytime temperature and rainfall. Swimming and winter conditions are highlighted separately where relevant.
April, May, June, July, August, September, October, November and December typically offer the most optimal weather in Mamiña. In contrast, January, February and March tend to have less optimal conditions. Mamiña has a distinct dry season from March to December.
Daytime highs range from 18°C (64°F) in February to 21°C (70°F) in October. Nighttime lows range from 6°C (43°F) to 10°C (50°F). Temperatures stay relatively stable year-round.
Annual rainfall is around 240 mm (9.4 in). February is the wettest month with 90 mm (3.5 in), while May is the driest with 1 mm (0.04 in).
Mamiña is highlighted - select any city to see its climate.
Where to go in October - average daytime high across popular destinations.
 San Pedro de Atacama23°C (73°F) Hanga Roa
 21°C (70°F) Santiago21°C (70°F) La Serena
 21°C (70°F) Viña del Mar17°C (63°F) Valparaíso16°C (61°F) Pucón
 15°C (59°F)
 Need travel inspiration? Check out our bucket list articles and be inspired.
The 10 most alternative cities in South America
Discover South America's top 10 alternative cities! From Valparaíso's vibrant streets to La Paz's high-altitude charm and Medellín's innovative spirit.
 Torres del Paine
Torres del Paine is an huge national park on the border with Argentina. It is possible to walk here along craters, high-rising mountain ridges, over glaciers and through vast majestic tundra.
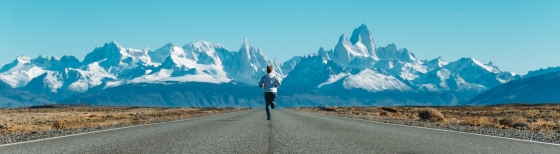 Explore Patagonia
A tour through Patagonia brings you to the end of the world. That’s why Patagonia is a bucket list destination for many. We recommend to visit Patagonia from November to early March.
 Enjoy the silence and peace in a spectacular landscape
This lodge guarantees privacy and exclusivity for those seeking to get away from mass tourism and enjoy the silence and peace in a spectacular landscape.