Lydbrook Climate by Month
Lydbrook experiences great temperature shifts.
The city's weather can transition from warm days
to cold weather.
It receives a reasonable amount of rain/snowfall.
Let’s explore the climate details in depth to provide you with a complete overview.
Average day and night temperature
The climate in Lydbrook is known for significant temperature differences throughout the year, making the weather dynamic. Average daytime temperatures reach a comfortable 22°C in July. In February, the coolest month of the year, temperatures drop to a chilly 9°C. At night, expect cooler temperatures, averaging 2°C during this month.
The mean minimum and maximum temperatures throughout the year

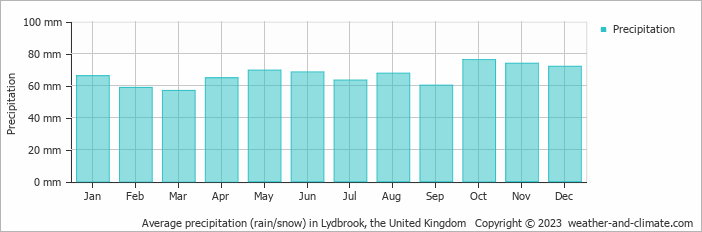
Precipitation and rainy days
Generally, Lydbrook receives mid-range precipitation levels, with 797 mm annually. Despite minor fluctuations, Lydbrook enjoys fairly consistent precipitation throughout the year. In October, you can expect around 76 mm of precipitation, while in March, Lydbrook receives about 57 mm.The mean monthly precipitation over the year, including rain, hail and snow
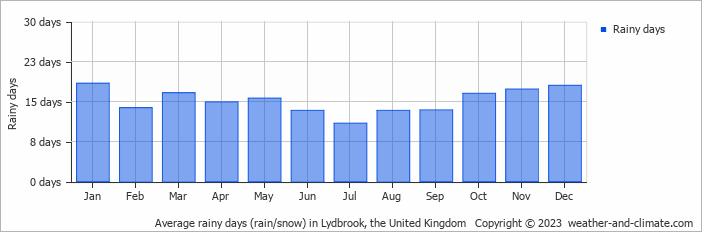
The average number of days each month with precipitation
Sunshine over the year
Lydbrook can be enjoyed more throughout the sunniest month of July under a blue sky, with approximately 6.6 hours of sunshine daily. In contrast, the city experiences much darker days in December, with only 1.6 hours of sunlight per day.Monthly hours of sunshine

Daily hours of sunshine
The best time of year to visit Lydbrook in the United Kingdom
During the months of June, July and August you are most likely to experience good weather with pleasant average temperatures that fall between 20°C and 26°C.Other facts from our historical weather data:
July has an average maximum temperature of 22°C and is the warmest month of the year.
The coldest month is February with an average maximum temperature of 9°C.
October tops the wettest month list with 76 mm of rainfall.
March is the driest month with 57 mm of precipitation.
July is the sunniest month with an average of 199 hours of sunshine.
No idea where to travel to this year? We have a tool that recommends destinations based on your ideal conditions. Find out where to go with our weather planner.


