Le Lamentin Weather & Climate: Best Time to Visit
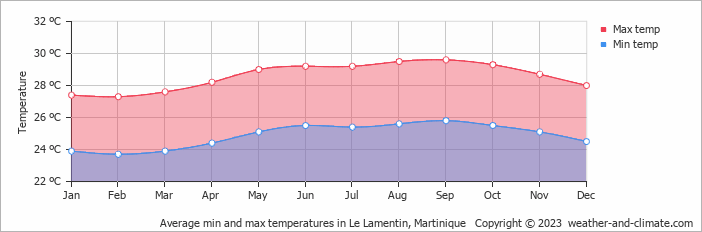
Le Lamentin, Martinique, has a stable climate with little temperature variation across the year. Average daytime temperatures hover around 29°C (84°F), peaking in September at 30°C (86°F) and dipping in February to 27°C (81°F).
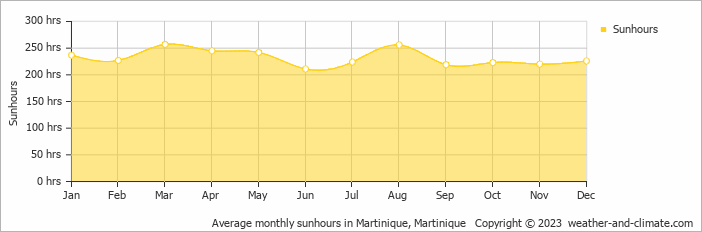
The city receives considerable rainfall, with around 1148 mm (45 in) annually. October is the wettest month. March is the sunniest month, averaging 8.6 hours of sunshine per day.
Monthly Temperature in Le Lamentin
With minimal seasonal shifts, Le Lamentin experiences a constant climate year-round. Typically, average maximum daytime temperatures range from a comfortable 30°C (86°F) in September to a comfortable 27°C (81°F) in the coolest month, February.
Nights vary from 26°C (79°F) in September to around 24°C (75°F) during the colder months.
Check out our detailed temperature page for more information.
Temperature ranges by month
Rainfall in Le Lamentin
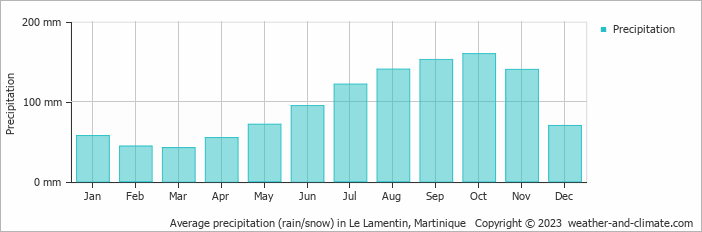
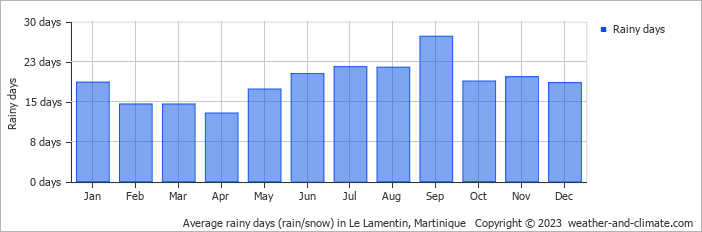
Le Lamentin has a notably wet climate with abundant precipitation, recording 1148 mm (45 in) of rainfall per year. The climate in Le Lamentin shows significant variation throughout the year. Expect high rainfall in October, the wettest month, with an average of 160 mm (6.3 in) of precipitation over 19 rainy days.
In contrast, the driest month March offers drier and sunnier days, with around 42 mm (1.7 in) of rainfall over 15 rainy days. For more details, please visit our Le Lamentin Precipitation page.
The mean monthly precipitation over the year, including rain, hail, and snow
The average number of days each month with precipitation
Sunshine Hours in Le Lamentin
If you're planning a trip to Le Lamentin, rest assured that sunshine is an important factor. With peak sunshine in March at 8.6 hours daily and a slight dip to 7.0 hours in June, it maintains a sunny destination year-round.
Visit our detailed sunshine hours page for more information.
Monthly hours of sunshine
Daily hours of sunshine
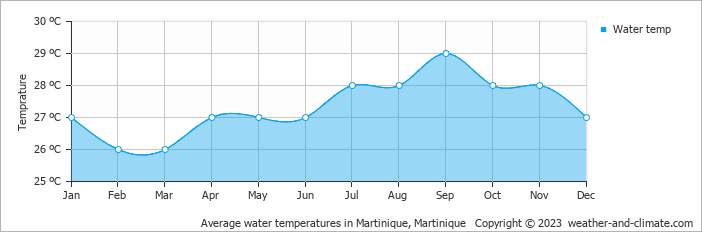
Water Temperature in Le Lamentin
The mean water temperature over the year ranges from 26°C (79°F) in February to 29°C (84°F) in September.
Water temperature over the year
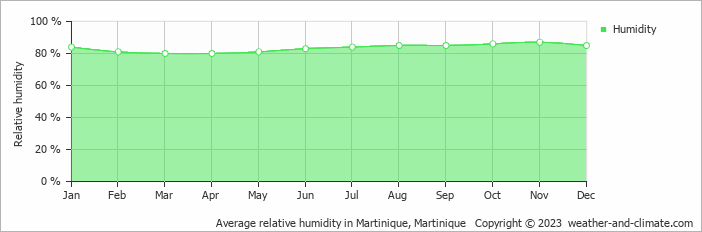
Humidity in Le Lamentin by Month
The city experiences its highest humidity in November, reaching 87%. In March, the humidity drops to its lowest level at 80%. What does this mean? Read our detailed page on humidity levels for further details.
Relative humidity over the year
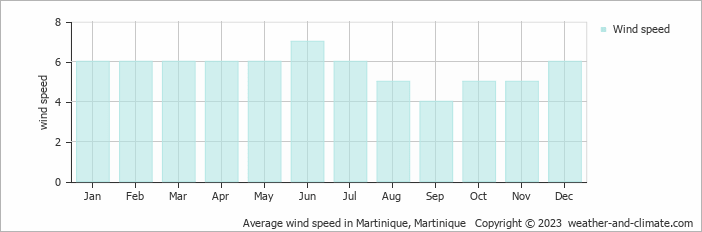
Wind Speed in Le Lamentin
The mean wind speed over the year ranges from 4 m/s (8 knots) in September to 7 m/s (14 knots) in June. What does this mean?
The mean monthly wind speed over the year (meters per second)
Le Lamentin 3-Day Forecast
Check the conditions for any month of the year.
Best Time to Visit Le Lamentin
With its warm weather, Le Lamentin experiences temperatures from 27°C (81°F) to 30°C (86°F) throughout the year. January, February, March and April offers the driest weather, which makes it a good time to visit.It's smart to plan your activities during the cooler morning hours or take advantage of the refreshing evenings. Planning your next adventure but unsure where to go? Our climate tool suggests perfect locations tailored to your preferred weather conditions. Discover your ideal travel destination with our weather planner.


