Latacunga Weather & Climate: Best Time to Visit
The climate in Latacunga, Cotopaxi Province, Ecuador, is remarkably consistent, with temperatures year-round averaging 15°C (59°F). The warmest month is October at 15°C (59°F), and the coolest is August at 14°C (57°F).
The city receives considerable rainfall, with around 1829 mm (72 in) annually. March is the wettest month. It has a distinct rainy season from November to April.
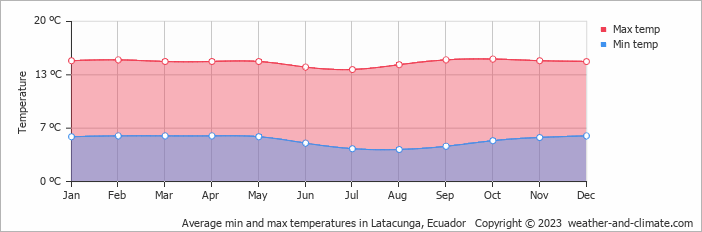
Monthly Temperature in Latacunga
In Latacunga temperatures are generally consistent throughout the year. Typically, average maximum daytime temperatures range from a moderate 15°C (59°F) in October to a moderate 14°C (57°F) in the coolest month, August.
Nights vary from 6°C (43°F) in October to around 4°C (39°F) during the colder months.
Check out our detailed temperature page for more information.
Temperature ranges by month
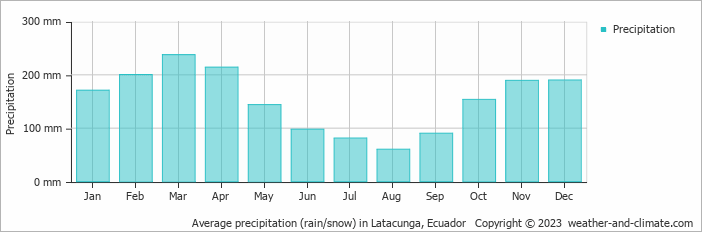
Rainfall in Latacunga
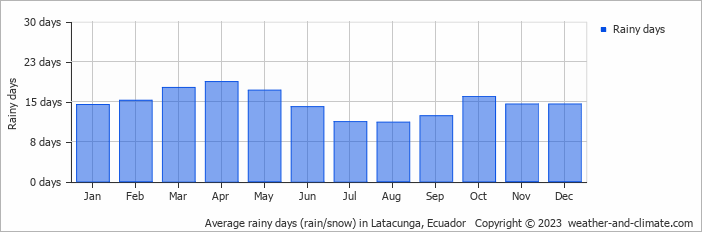
Latacunga experiences significant rainfall throughout the year, averaging 1829 mm (72 in) of precipitation annually. The climate in Latacunga shows significant variation throughout the year. Expect heavy rainfall in March, the wettest month, with an average of 237 mm (9.3 in) of precipitation over 18 rainy days.
In contrast, the driest month August offers drier and sunnier days, with around 60 mm (2.4 in) of rainfall over 11 rainy days. For more details, please visit our Latacunga Precipitation page.
The mean monthly precipitation over the year, including rain, hail, and snow
The average number of days each month with precipitation
Latacunga 3-Day Forecast
Check the conditions for any month of the year.
Best Time to Visit Latacunga
Weather patterns in Latacunga vary throughout the year, offering different conditions for visitors depending on the season. Each time of year brings its own unique weather characteristics. If we needed to point out one good month to visit, it would be August, the driest month with 60 mm (2.4 in) of rainfall.Be aware that January, February, March, April, November and December typically bring the highest precipitation levels. Wondering where to travel based on your weather preferences? Our recommendation tool helps you find destinations with your ideal climate conditions. Use our weather planner to find your perfect destination.


