Las Conchas Weather & Climate: Best Time to Visit
Average temperatures, rainfall, sunshine and the best time to visit Las Conchas.
Climate overview of Las Conchas
Las Conchas, Mexico, experiences significant temperature variation throughout the year. Summers bring daytime highs of 35°C (95°F) in August, while winters cool to 20°C (68°F) in January.
The area sees almost no rainfall, totalling just 87 mm (3.4 in) per year.
Las Conchas Weather by Month
Pick a month to see the average temperature, rainfall and sunshine in Las Conchas — and find the best time to visit.
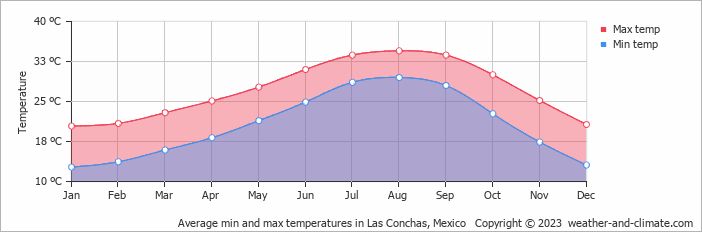
Monthly Temperature in Las Conchas
Depending on the time of the year, temperatures range from very warm to pleasant in Las Conchas. Typically, average maximum daytime temperatures range from a very warm 35°C (95°F) in August to a pleasant 20°C (68°F) in the coolest month, January.
Nights vary from 30°C (86°F) in August to around 13°C (55°F) during the colder months.
Check out our detailed temperature page for more information.
Temperature ranges by month
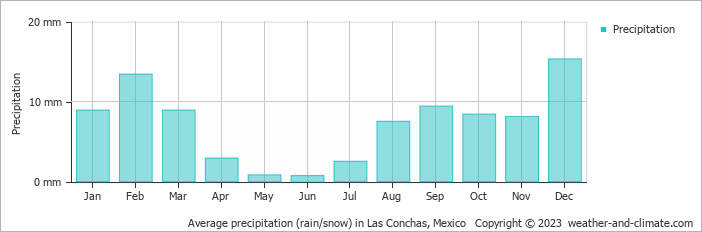
Rainfall in Las Conchas
Las Conchas has a dry climate with very low precipitation, averaging 87 mm (3.4 in) of rainfall annually. The climate in Las Conchas shows significant variation throughout the year. Expect low rainfall in December, the wettest month, with an average of 15 mm (0.6 in) of precipitation over 2 rainy days.
In contrast, the driest month June offers drier and sunnier days, with around 0.7 mm (0.03 in) of rainfall over 0 rainy days. For more details, please visit our Las Conchas Precipitation page.
The mean monthly precipitation over the year, including rain, hail, and snow
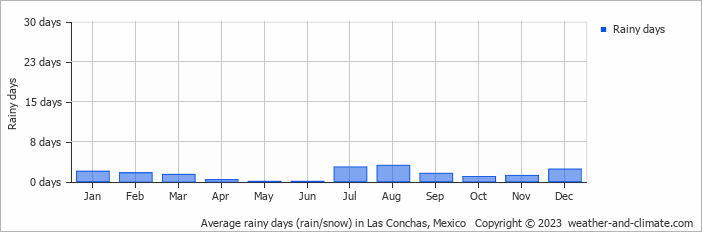
The average number of days each month with precipitation
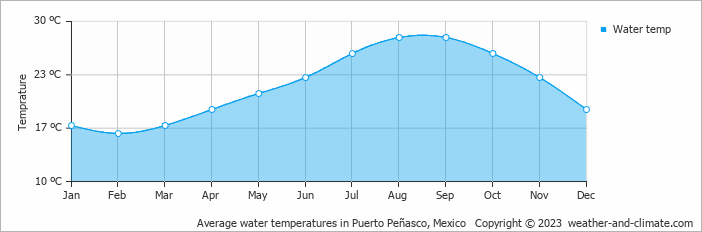
Water Temperature in Las Conchas
The mean water temperature over the year ranges from 16°C (61°F) in February to 28°C (82°F) in August.
Water temperature over the year
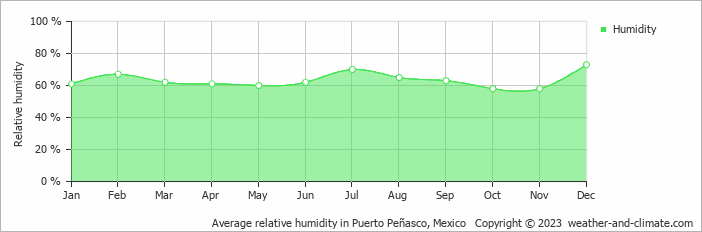
Humidity in Las Conchas by Month
The relative humidity is high throughout the year in Las Conchas.
The city experiences its highest humidity in December, reaching 73%. In October, the humidity drops to its lowest level at 58%. What does this mean? Read our detailed page on humidity levels for further details.
Relative humidity over the year
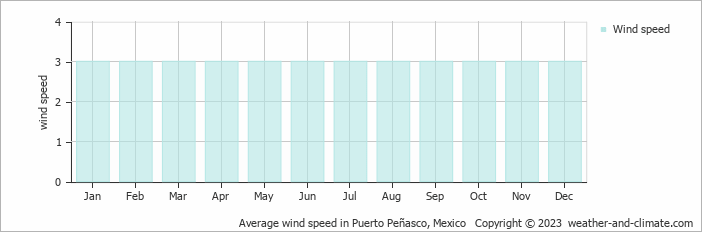
Wind Speed in Las Conchas
The mean wind speed over the year ranges from 3 m/s (6 knots) in January, February, March, April, May, June, July, August, September, October, November and December to 3 m/s (6 knots) in January, February, March, April, May, June, July, August, September, October, November and December. What does this mean?
The mean monthly wind speed over the year (meters per second)
Best Time to Visit Las Conchas
The consistently dry weather means you can step outside without worrying about rain, though remember to carry water and sun protection. Planning your next adventure but unsure where to go? Our climate tool suggests perfect locations tailored to your preferred weather conditions. Discover your ideal travel destination with our weather planner.
Frequently asked questions about the climate in Las Conchas
What is the best time to visit Las Conchas?
January, February, March, April, May, November and December typically offer the most optimal weather in Las Conchas. In contrast, July, August and September tend to have less optimal conditions. Las Conchas has a distinct dry season from January to December.
What temperatures can I expect in Las Conchas?
Daytime highs range from 20°C (68°F) in January to 35°C (95°F) in August. Nighttime lows range from 13°C (55°F) to 30°C (86°F). Temperatures vary considerably through the year.
How much rain does Las Conchas get?
Annual rainfall is around 87 mm (3.4 in). December is the wettest month with 15 mm (0.6 in), while June is the driest with 0.7 mm (0.03 in).
Las Conchas 3-Day Forecast
Las Conchas 3-Day Forecast
Las Conchas on the map
Las Conchas is highlighted — select any city to see its climate.
Popular this month
Where to go in June — average daytime high across popular destinations.
Bucket list
Need travel inspiration? Check out our bucket list articles and be inspired.
 Explore the Majestic Copper Canyons of Mexico
Explore the vast Copper Canyons in Chihuahua, Mexico—larger than the Grand Canyon. Discover scenic train rides, hikes, and the Tarahumara people.
These are the most beautiful Mayan ruins and Mayan temples in Mexico
Mexico is a destination where you can immerse yourself in ancient cultures and civilizations. In this article we have listed our favorite Mayan ruins.
Tips, to-do's and nicest restaurants in Mexico City
Mexico City, one of the most famous and notorious cities of the world. The best time to visit is between March and May, but it can be visited year round.
Zihuatanejo: A Pacific paradise with beautiful beaches
Zihuatanejo has some of Mexico's top beaches. Unlike other off-the-beaten-path destinations in Mexico, Zihua is very accessible and sustainable.