Average monthly wind speed in Las Conchas
Here you can view the typical wind conditions throughout the year in Las Conchas, (), Mexico.
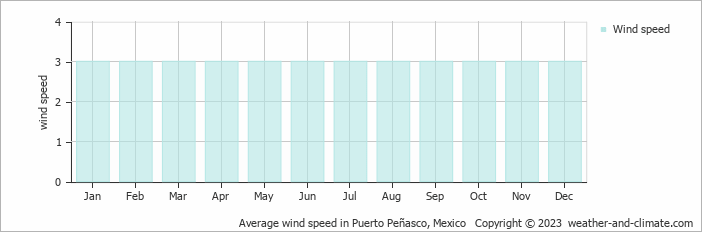
Annually, wind speeds in Las Conchas vary between 3 m/s (6 knots) at their lowest and 3 m/s (6 knots) at their peak.
The average wind speed is 3 m/s (6 knots) during January, February, March, April, May, June, July, August, September, October, November and December, indicating consistent yet manageable airflow. Daily conditions vary, with some days bringing stronger breezes. At the average speed, foliage moves steadily, and flags show noticeable motion. In common units, this equals about 11 kilometers per hour or 6.7 miles per hour. Overall, it's are pleasant months to be outdoors in terms of wind conditions.
For more detailed information about Las Conchas’s weather, including monthly rainfall, sunshine hours, and humidity levels, visit our Las Conchas climate page.


