Lamphun Weather & Climate: Best Time to Visit
Average temperatures, rainfall, sunshine and the best time to visit Lamphun.
Climate overview of Lamphun
Lamphun, in Thailand's Lamphun Province, experiences moderate temperature changes through the seasons. Very hot days transition to very warm cooler months, while the area is known for receiving heavy rainfall during certain periods. Lamphun is an ancient town which where people come to visit the beautiful Wat Phra That Hariphunchai temple and explore traditional Lanna culture. Let's explore the climate details to provide you with a complete overview on when to visit.
Lamphun Weather by Month
Pick a month to see the average temperature, rainfall and sunshine in Lamphun — and find the best time to visit.
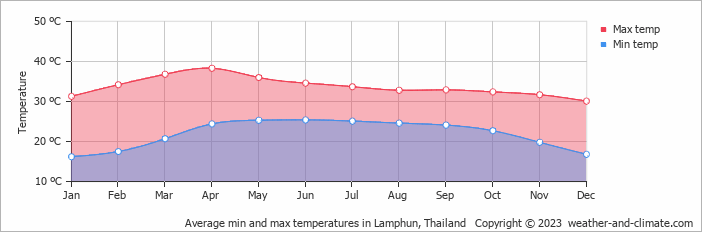
Monthly Temperature in Lamphun
The weather in Lamphun changes moderately throughout the year, offering enough variation to appreciate each season. Typically, average maximum daytime temperatures range from a very hot 38°C (100°F) in April to a very warm 30°C (86°F) in the coolest month, January.
Nights vary from 25°C (77°F) in April to around 16°C (61°F) during the colder months.
Check out our detailed temperature page for more information.
Temperature ranges by month
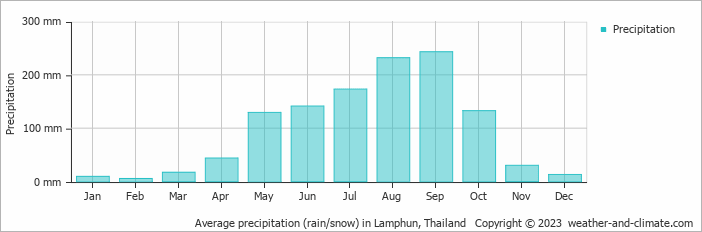
Rainfall in Lamphun
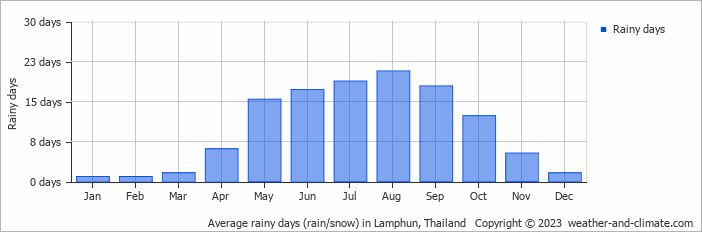
Lamphun has a notably wet climate with abundant precipitation, recording 1169 mm (46 in) of rainfall per year. The climate in Lamphun shows significant variation throughout the year. Expect heavy rainfall in September, the wettest month, with an average of 243 mm (9.6 in) of precipitation over 18 rainy days.
In contrast, the driest month February offers drier and sunnier days, with around 5.3 mm (0.2 in) of rainfall over a single rainy day. For more details, please visit our Lamphun Precipitation page.
The mean monthly precipitation over the year, including rain, hail, and snow
The average number of days each month with precipitation
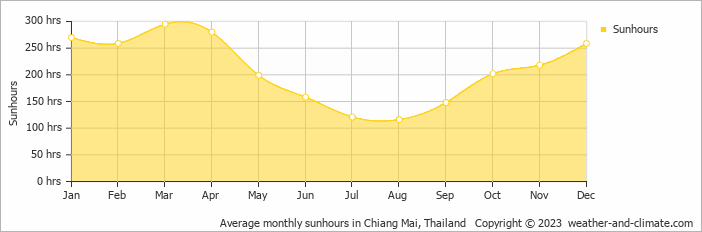
Sunshine Hours in Lamphun
For those who appreciate different seasons, Lamphun serves as an ideal destination. Expect longer, more sun-filled days in March with an average of 9.8 hours of sunshine daily, and embrace the darker days in August, offering only 3.9 hours of daily sunlight.
Visit our detailed sunshine hours page for more information.
Monthly hours of sunshine
Daily hours of sunshine
Humidity in Lamphun by Month
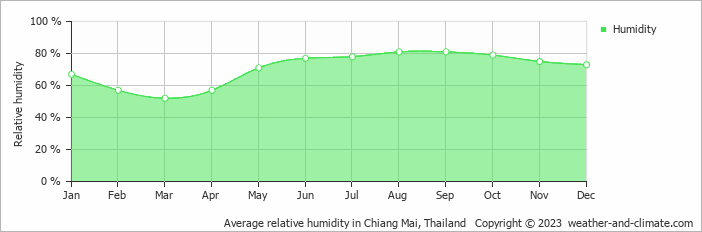
The relative humidity is high throughout the year in Lamphun.
The city experiences its highest humidity in August, reaching 81%. In March, the humidity drops to its lowest level at 52%. What does this mean? Read our detailed page on humidity levels for further details.
Relative humidity over the year
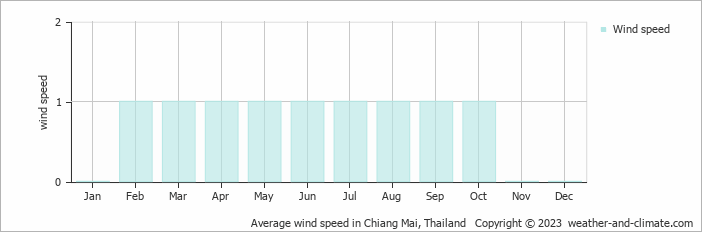
Wind Speed in Lamphun
The mean wind speed varies between () and 1 m/s (2 knots) throughout the year. It is lowest in January, November and December and highest during February, March, April, May, June, July, August, September and October. What does this mean?
The mean monthly wind speed over the year (meters per second)
Best Time to Visit Lamphun
It's smart to plan your activities during the cooler morning hours or take advantage of the refreshing evenings.
Note that July, August and September make up the rainy season, with heavier precipitation expected. Wondering where to travel based on your weather preferences? Our recommendation tool helps you find destinations with your ideal climate conditions. Use our weather planner to find your perfect destination.
Frequently asked questions about the climate in Lamphun
What is the best time to visit Lamphun?
January, November and December typically offer the most optimal weather in Lamphun. In contrast, February, March, April, May, June, July, August and September tend to have less optimal conditions. Lamphun has distinct dry (November to March) and wet (July to September) seasons.
What temperatures can I expect in Lamphun?
Daytime highs range from 30°C (86°F) in January to 38°C (100°F) in April. Nighttime lows range from 16°C (61°F) to 25°C (77°F).
How much rain does Lamphun get?
Annual rainfall is around 1169 mm (46 in). September is the wettest month with 243 mm (9.6 in), while February is the driest with 5.3 mm (0.2 in).
How sunny is Lamphun?
Lamphun receives around 2,525 hours of sunshine per year. March is the sunniest month with 295 hours, while August is the cloudiest with just 116 hours. Overall, Lamphun enjoys abundant sunshine.
Lamphun 3-Day Forecast
Lamphun 3-Day Forecast
Lamphun on the map
Lamphun is highlighted — select any city to see its climate.
Popular this month
Where to go in July — average daytime high across popular destinations.
Bucket list
Need travel inspiration? Check out our bucket list articles and be inspired.
 Discover Kok Kood: a hidden gem in Thailand
Discover the hidden gem of Thailand - Koh Kood! Explore stunning beaches, waterfalls and eco-friendly resorts while enjoying a peaceful atmosphere away from the crowds.
Discover Thailand: An Ultimate Guide for Yogis
Explore Thailand's best for yogis: serene retreats, spiritual growth, and adventure. Dive into yoga, meditation, and nature's tranquility for an unforgettable journey.
Trekking in Northern Thailand
One of the most beautiful attractions in Thailand is trekking along mountain villages north of Chiang Mai. The best time to trek is November until February.
Elephant Haven in Thailand: Kindred Spirit Sanctuary
Explore the Kindred Spirit Elephant Sanctuary in Thailand. Experience hiking, observe elephants in nature, and see the positive impact on the community.