

















 Magical Split
The best travel time to Split in Croatia is from May til October and the best months are May, June and September.
Average temperatures, rainfall, sunshine and the best time to visit Krivi Put.
 –
–
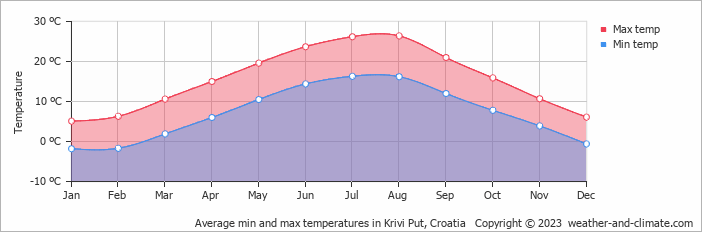
Temperatures in Krivi Put, Lika-Senj County, Croatia, vary greatly throughout the year. August is the hottest month at 26°C (79°F), while January is the coldest at 5°C (41°F).
With around 1466 mm (58 in) of annual rain/snowfall, Krivi Put has a notably wet climate. However, this rain/snowfall is not evenly distributed, the city has warm summers and cold winters. The wettest month is November. Sunshine peaks in July, when the city sees around 10.3 hours of sunshine per day.
Pick a month to see the average temperature, rainfall and sunshine in Krivi Put - and find the best time to visit.
The climate in Krivi Put is known for significant temperature differences throughout the year, making the weather dynamic. Average daytime temperatures reach a comfortable 26°C (79°F) in August. In January, the coolest month of the year, temperatures drop to a chilly 5°C (41°F).
At night, temperatures range from around 16°C (61°F) in August to -2°C (28°F) in January.
Check out our detailed temperature page for more information.
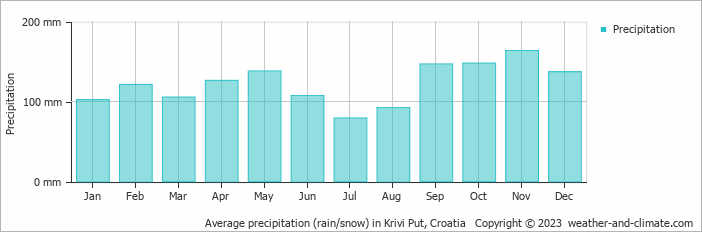
Krivi Put has a notably wet climate with abundant precipitation, recording 1466 mm (58 in) of rain/snowfall per year. Krivi Put experiences moderate seasonal variation in rainfall, with monthly averages ranging from 164 mm (6.5 in) in November, the wettest month, and 79 mm (3.1 in) in July, the driest month. For more details, please visit our Krivi Put Precipitation page.
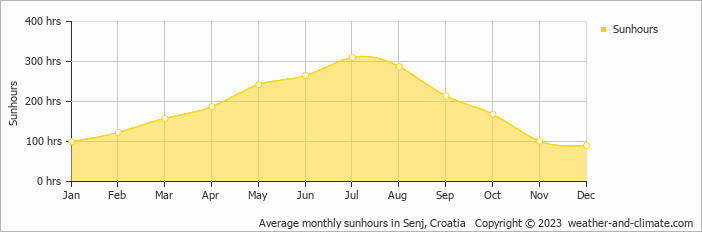
Krivi Put can be enjoyed more throughout the sunniest month of July under a blue sky, with approximately 10.3 hours of sunshine daily. In contrast, the city experiences much darker days in December, with only 3.0 hours of sunlight per day.
Visit our detailed sunshine hours page for more information.
Monthly ratings reflect general weather comfort, based on daytime temperature and rainfall. Swimming and winter conditions are highlighted separately where relevant.
July and August typically offer the most optimal weather in Krivi Put. In contrast, January, February, March, November and December tend to have less optimal conditions. Krivi Put has warm summers and cold winters.
Daytime highs range from 5°C (41°F) in January to 26°C (79°F) in August. Nighttime lows range from -2°C (28°F) to 16°C (61°F). Temperatures vary considerably through the year.
Annual rainfall is around 1466 mm (58 in). November is the wettest month with 164 mm (6.5 in), while July is the driest with 79 mm (3.1 in).
Krivi Put receives around 2,245 hours of sunshine per year. July is the sunniest month with 310 hours, while December is the cloudiest with just 90 hours. Overall, Krivi Put enjoys abundant sunshine.
Krivi Put is highlighted - select any city to see its climate.
Where to go in September - average daytime high across popular destinations.
Need travel inspiration? Check out our bucket list articles and be inspired.
Magical Split
The best travel time to Split in Croatia is from May til October and the best months are May, June and September.
 Sail the crystal-clear waters of Croatia and enjoy its stunning coastline
Croatia is an idyllic sailing destination, boasting 1,777 miles (2,860 km) of beautiful beaches and pristine waters. With over 1,000 Islands dotting the Adriatic Sea, there's a perfect spot for everyone.

 Cycle the Danube trail
The Danube cycle route is one of the most popular cycling routes in Europe, and rightly so, because it is a varied route that is interesting both in terms of culture and nature.

 The 10 most charming villages in France
Discover France's top 10 beautiful villages. From Normandy to the Côte d'Azur, experience quaint squares and cobbled streets. Which one will you visit this summer?