Krasiczyn Weather and Climate: A Comprehensive Guide
Krasiczyn experiences great temperature shifts.
The city's weather can transition from warm days
to very cold weather.
It receives mid-range precipitation levels.
Now, let’s explore all the climate details to give you a full picture.
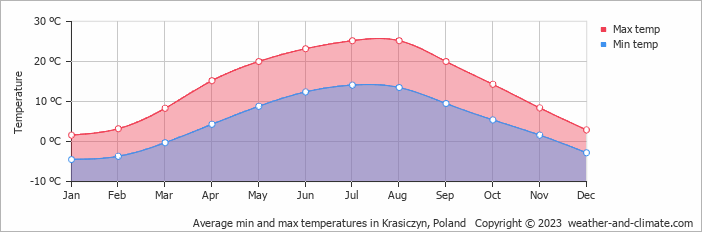
Average maximum day and minimum night temperature
The climate in Krasiczyn is known for significant temperature differences throughout the year, making the weather dynamic. Average maximum daytime temperatures range from a comfortable 25°C in July, the warmest time of the year, to a very cold 2°C during cooler months like January.
At night, temperatures typically drop to an average of around -5°C during these months. Check out our detailed temperature page for more information.Temperature ranges by month
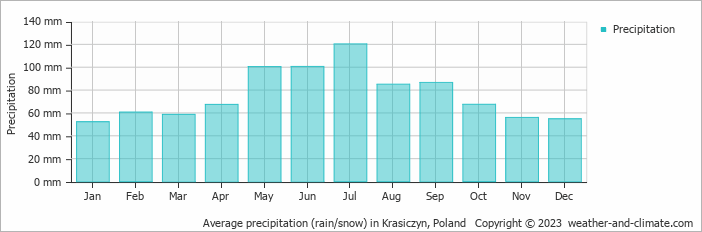
Precipitation and rainy days
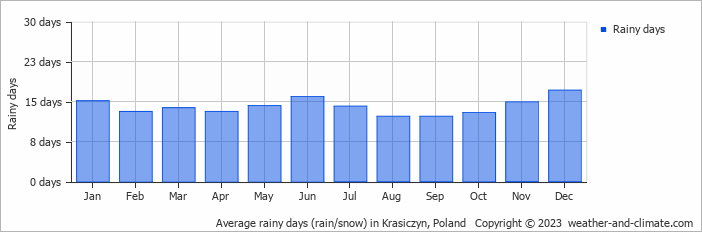
Generally, Krasiczyn receives mid-range precipitation levels, with 909 mm annually. Significant seasonal changes in precipitation occur throughout the year. During the wetter season, July receives high rainfall, averaging 120 mm of precipitation, recorded across 14 rainy days. In contrast, the drier season, January brings less snow/rainfall, with 52 mm over 15 snowy/rainy days. For more details, please visit our Krasiczyn Precipitation page.The mean monthly precipitation over the year, including rain, hail and snow
The average number of days each month with precipitation
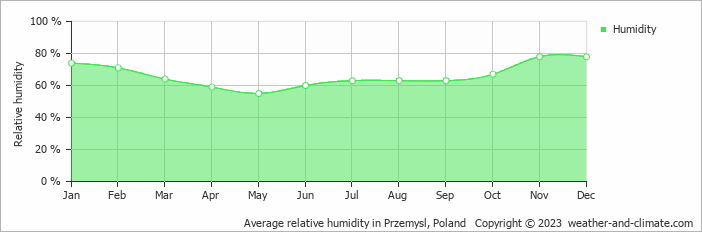
Average humidity
The relative humidity is high throughout the year in Krasiczyn.
The city experiences its highest humidity in November, reaching 78%. In May, the humidity drops to its lowest level at 55%. Explore our detailed page on humidity levels for further details.
Relative humidity over the year
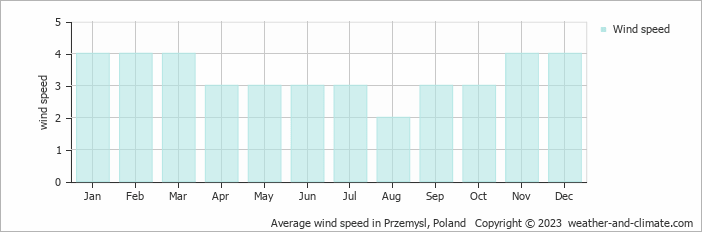
Average wind speed
The mean wind speed over the year ranges from 2 m/s in August to 4 m/s in January, February, March, November and December.
The mean monthly wind speed over the year (meters per second)
broken clouds and chance of slight rain overcast and sleet overcast and heavy snowForecast for Krasiczyn
 9 m/s
9 m/s![]() 2 m/s
2 m/s![]() 5 m/s
5 m/s![]()
The best time of year to visit Krasiczyn in Poland
During the months of May, June, July, August and September you are most likely to experience good weather with pleasant average temperatures that fall between 20°C and 26°C.Other facts from our historical weather data:
August has an average maximum temperature of 25°C and is the warmest month of the year.
The coldest month is January with an average maximum temperature of 2°C.
July tops the wettest month list with 120 mm of rainfall.
January is the driest month with 52 mm of precipitation.
No idea where to travel to this year? We have a tool that recommends destinations based on your ideal conditions. Find out where to go with our weather planner.


