Kinneret Weather & Climate: Best Time to Visit
Average temperatures, rainfall, sunshine and the best time to visit Kinneret.
Climate overview of Kinneret
Kinneret, North District Israel, Israel, experiences significant temperature variation throughout the year. Summers bring daytime highs of 36°C (97°F) in August, while winters cool to 18°C (64°F) in January.
The city has a relatively dry climate, receiving around 385 mm (15 in) of rainfall per year. It does experience a distinct dry season from April to November. February is the wettest month and July the driest. The most sunshine falls in July, with an average of 12.8 hours of daily sunshine.
Kinneret Weather by Month
Pick a month to see the average temperature, rainfall and sunshine in Kinneret — and find the best time to visit.
Monthly Temperature in Kinneret
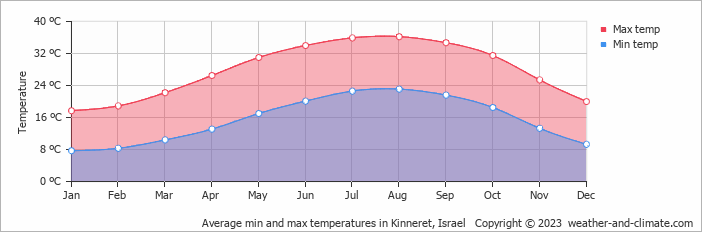
Depending on the time of the year, temperatures range from very hot to moderate in Kinneret. On average, daytime temperatures range from a very hot 36°C (97°F) in August to a moderate 18°C (64°F) in January.
Nighttime temperatures range from 23°C (73°F) in August to 8°C (46°F) in January.
Check out our detailed temperature page for more information.
Temperature ranges by month
Rainfall in Kinneret
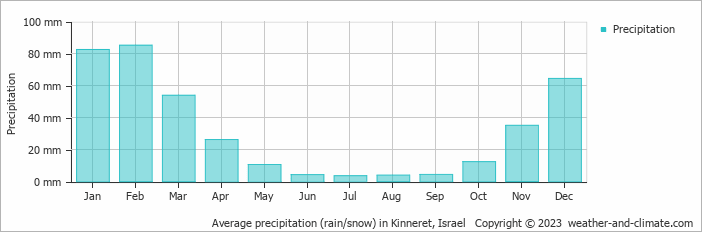
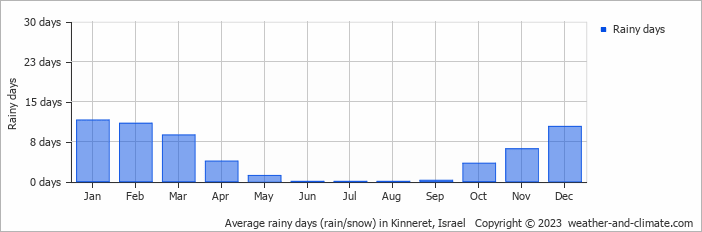
Kinneret has a relatively dry climate with low precipitation, averaging 385 mm (15 in) of rainfall annually. The seasons in Kinneret bring significant changes in precipitation. The wettest month, February, receives moderate rainfall, with an average of 85 mm (3.3 in) of precipitation. This rainfall is distributed across 11 rainy days.
In contrast, the driest month, July, experiences much less rainfall, totaling 3.5 mm (0.1 in) over 0 rainy days. These distinct seasonal differences provide diverse experiences throughout the year. For more details, please visit our Kinneret Precipitation page.
The mean monthly precipitation over the year, including rain, hail, and snow
The average number of days each month with precipitation
Sunshine Hours in Kinneret
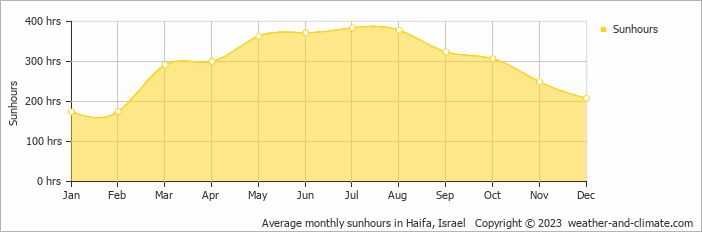
In Kinneret, summer days are longer and more sunny, with daily sunshine hours peaking at 12.8 hours in July. As the darker season arrives, the brightness of the sun becomes less. January sees a soft sun for only 5.8 hours per average day.
Visit our detailed sunshine hours page for more information.
Monthly hours of sunshine
Daily hours of sunshine
Humidity in Kinneret by Month
The relative humidity is high throughout the year in Kinneret.
The city experiences its highest humidity in August, reaching 81%. In November, the humidity drops to its lowest level at 58%. What does this mean? Read our detailed page on humidity levels for further details.
Relative humidity over the year

Best Time to Visit Kinneret
Rainfall during this time ranges from 26 mm (1 in) in April to 85 mm (3.3 in) in February. This means you can expect a mix of sunny days and occasional showers. Need help choosing your next travel destination? We offer a specialized tool that matches you with locations based on your weather preferences. Explore destinations that suit your climate preferences.
Frequently asked questions about the climate in Kinneret
What is the best time to visit Kinneret?
March, April, November and December typically offer the most optimal weather in Kinneret. In contrast, June, July, August and September tend to have less optimal conditions. Kinneret has a distinct dry season from April to November.
What temperatures can I expect in Kinneret?
Daytime highs range from 18°C (64°F) in January to 36°C (97°F) in August. Nighttime lows range from 8°C (46°F) to 23°C (73°F). Temperatures vary considerably through the year.
How much rain does Kinneret get?
Annual rainfall is around 385 mm (15 in). February is the wettest month with 85 mm (3.3 in), while July is the driest with 3.5 mm (0.1 in).
How sunny is Kinneret?
Kinneret receives around 3,525 hours of sunshine per year. July is the sunniest month with 384 hours, while January is the cloudiest with just 174 hours. Overall, Kinneret enjoys abundant sunshine.
Kinneret 3-Day Forecast
Kinneret 3-Day Forecast
Kinneret on the map
Kinneret is highlighted — select any city to see its climate.
Popular this month
Where to go in June — average daytime high across popular destinations.
Bucket list
Need travel inspiration? Check out our bucket list articles and be inspired.
 Hike the Israel National Trail
If you consider hiking the entire trail, then the best time of year for the trek is February to May. The weather is pretty mild at this time of the year.
Midburn: The Israeli version of Burning Man
Midburn is an amazing event held in a desert in southern Israel called Negev. Just like burning man, a temporary city is established in the middle of the desert every year.