Katalagárion Weather & Climate: Best Time to Visit
Average temperatures, rainfall, sunshine and the best time to visit Katalagárion.
Climate overview of Katalagárion
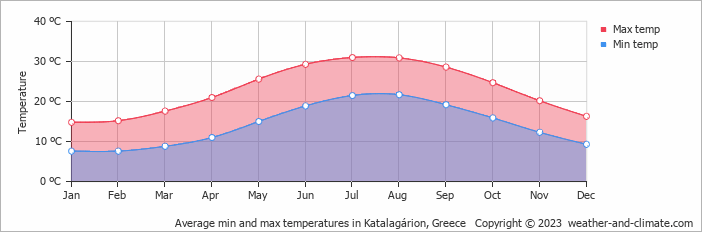
Temperatures in Katalagárion, Crete, Greece, vary greatly throughout the year. July is the hottest month at 31°C (88°F), while January is the coldest at 15°C (59°F).
Rainfall is modest, totalling around 493 mm (19 in) annually. The city experiences a distinct dry season from April to September. February tends to be the wettest month. The sunniest month is July, with 12.4 hours of sunshine per day on average.
Katalagárion Weather by Month
Pick a month to see the average temperature, rainfall and sunshine in Katalagárion — and find the best time to visit.
Monthly Temperature in Katalagárion
The climate in Katalagárion is known for significant temperature differences throughout the year, making the weather dynamic. Average maximum daytime temperatures range from a very warm 31°C (88°F) in July, the warmest time of the year, to a moderate 15°C (59°F) during cooler months like January.
At night, you can expect temperatures ranging from 22°C (72°F) in July to around 8°C (46°F) during January.
Check out our detailed temperature page for more information.
Temperature ranges by month
Rainfall in Katalagárion
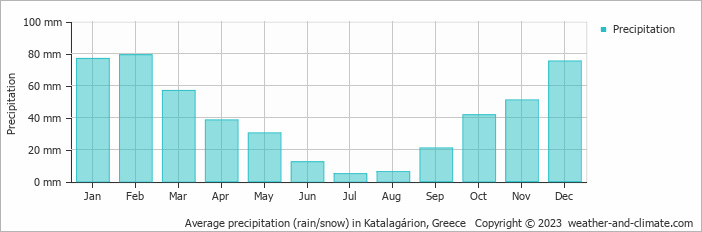
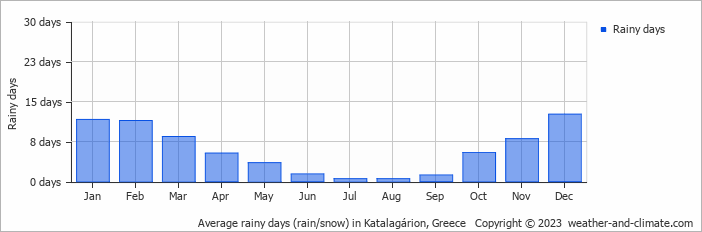
With annual rainfall averaging 493 mm (19 in), Katalagárion maintains relatively low precipitation levels throughout the seasons. Significant seasonal changes in precipitation occur throughout the year. In the wettest month, February it receives moderate rainfall, averaging 79 mm (3.1 in) of precipitation, recorded across 11 rainy days. In contrast, the driest month July brings less rainfall, with 4.8 mm (0.2 in) over a single rainy day. For more details, please visit our Katalagárion Precipitation page.
The mean monthly precipitation over the year, including rain, hail, and snow
The average number of days each month with precipitation
Sunshine Hours in Katalagárion
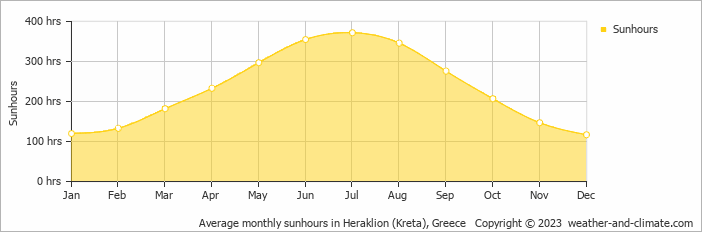
Seasonal changes in sunshine hours are quite dramatic in Katalagárion. While July receives considerable daily sunshine with up to 12.4 hours, December marks the darkest time of the year, where sunshine is scarce with only 3.9 hours of sunlight per day.
Visit our detailed sunshine hours page for more information.
Monthly hours of sunshine
Daily hours of sunshine
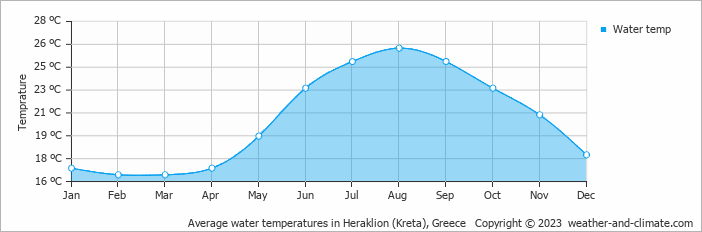
Water Temperature in Katalagárion
The mean water temperature over the year ranges from 17°C (63°F) in February to 26°C (79°F) in August.
Water temperature over the year
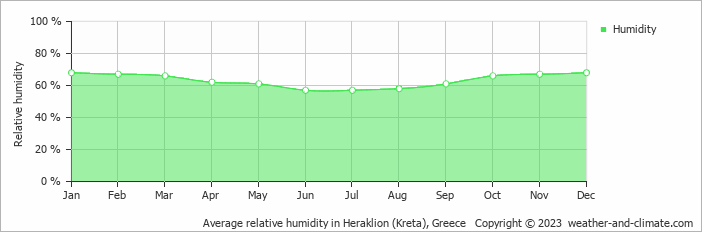
Humidity in Katalagárion by Month
The relative humidity is high throughout the year in Katalagárion.
The city experiences its highest humidity in January, reaching 68%. In June, the humidity drops to its lowest level at 57%. What does this mean? Read our detailed page on humidity levels for further details.
Relative humidity over the year
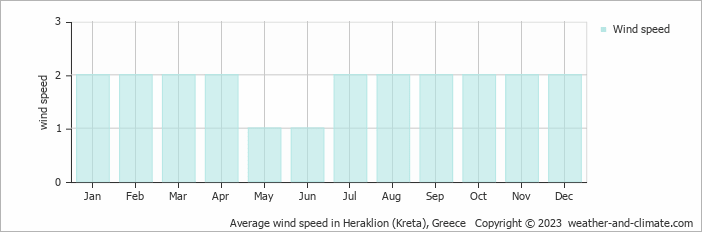
Wind Speed in Katalagárion
The average wind speed over the year ranges from 1 m/s (2 knots) to 2 m/s (4 knots). It is lower in May and June and higher in January, February, March, April, July, August, September, October, November and December. What does this mean?
The mean monthly wind speed over the year (meters per second)
Best Time to Visit Katalagárion
Frequently asked questions about the climate in Katalagárion
What is the best time to visit Katalagárion?
April, May, June, September, October and November typically offer the most optimal weather in Katalagárion. In contrast, January, February and December tend to have less optimal conditions. Katalagárion has a distinct dry season from April to September.
What temperatures can I expect in Katalagárion?
Daytime highs range from 15°C (59°F) in January to 31°C (88°F) in July. Nighttime lows range from 8°C (46°F) to 22°C (72°F). Temperatures vary considerably through the year.
How much rain does Katalagárion get?
Annual rainfall is around 493 mm (19 in). February is the wettest month with 79 mm (3.1 in), while July is the driest with 4.8 mm (0.2 in).
How sunny is Katalagárion?
Katalagárion receives around 2,785 hours of sunshine per year. July is the sunniest month with 372 hours, while December is the cloudiest with just 117 hours. Overall, Katalagárion enjoys abundant sunshine.
Katalagárion 3-Day Forecast
Katalagárion 3-Day Forecast
Katalagárion on the map
Katalagárion is highlighted — select any city to see its climate.
Popular this month
Where to go in July — average daytime high across popular destinations.
Bucket list
Need travel inspiration? Check out our bucket list articles and be inspired.
 Top 5 secluded beaches in Greece
Explore Greece's hidden gems: secluded beaches like Fokos, Seychelles, Potami, Kedrodasos, and Mouros for tranquil adventures away from crowds.
Discover Zakynthos
On the Greek island you can discover the rugged coastline, authentic old villages, a beautiful interior and the caves with the beautiful azure water.
Why Santorini should be on every Bucket List
This Greek island is home to some of the most stunning scenery globally, with its beautiful Caldera views, white-washed houses and crystal-clear waters.