Jurdani Weather & Climate: Best Time to Visit
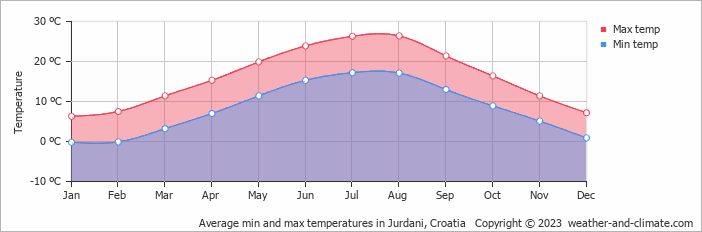
Jurdani, Istria, Croatia, experiences significant temperature variation throughout the year. Summers bring daytime highs of 26°C (79°F) in August, while winters cool to 6°C (43°F) in January.
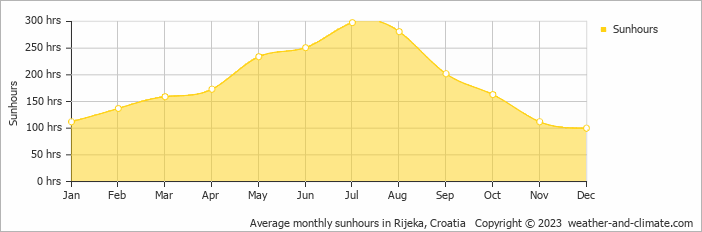
With around 1903 mm (75 in) of annual rain/snowfall, Jurdani has a notably wet climate. However, this rain/snowfall is not evenly distributed — the city has a distinct rainy season from September to December. The wettest month is November. The sunniest month is July, with 9.9 hours of sunshine per day on average.
Monthly Temperature in Jurdani
Depending on the time of the year, temperatures range from comfortable to chilly in Jurdani. Average daytime temperatures reach a comfortable 26°C (79°F) in August. In January, the coolest month of the year, temperatures drop to a chilly 6°C (43°F).
At night, temperatures range from around 17°C (63°F) in August to 0°C (32°F) in January.
Check out our detailed temperature page for more information.
Temperature ranges by month
Rainfall in Jurdani
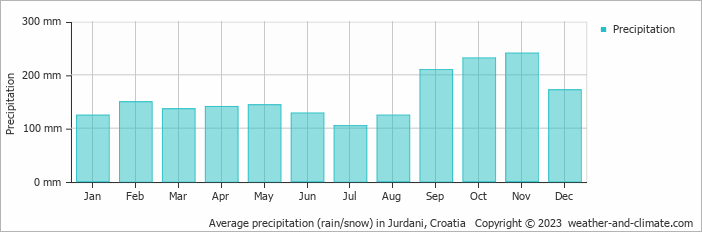
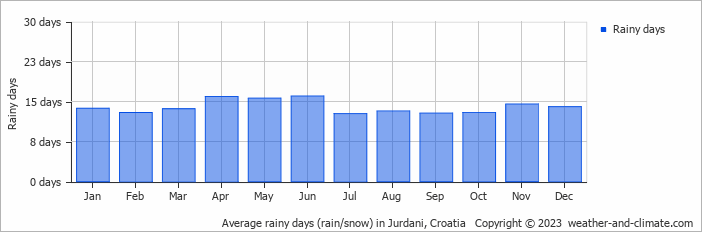
Jurdani has a relatively rain/snowy climate with high precipitation levels, averaging 1903 mm (75 in) of rain/snowfall annually. Jurdani can be quite wet during November, receiving approximately 241 mm (9.5 in) of precipitation over 15 rainy days.
In contrast, during the driest month (July), you will experience much drier conditions, with 104 mm (4.1 in) of precipitation spread across 13 rainy days days. For more details, please visit our Jurdani Precipitation page.
The mean monthly precipitation over the year, including rain, hail, and snow
The average number of days each month with precipitation
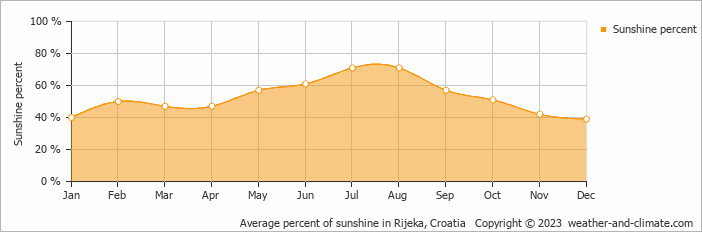
Sunshine Hours in Jurdani
Jurdani can be enjoyed more throughout the sunniest month of July under a blue sky, with approximately 9.9 hours of sunshine daily. In contrast, the city experiences much darker days in December, with only 3.3 hours of sunlight per day.
Visit our detailed sunshine hours page for more information.
Monthly hours of sunshine
Daily hours of sunshine
Daily percentage of sunshine
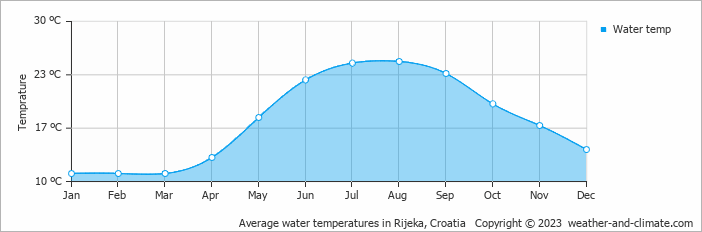
Water Temperature in Jurdani
The mean water temperature over the year ranges from 11°C (52°F) in January to 25°C (77°F) in August.
Water temperature over the year
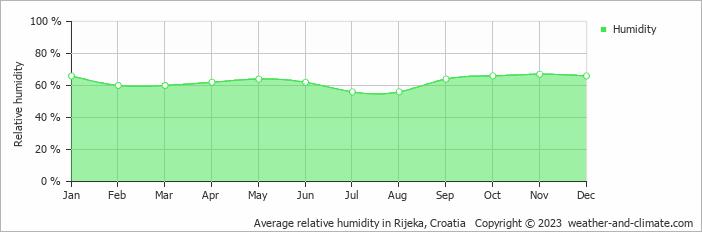
Humidity in Jurdani by Month
The relative humidity is high throughout the year in Jurdani.
The city experiences its highest humidity in November, reaching 67%. In July, the humidity drops to its lowest level at 56%. What does this mean? Read our detailed page on humidity levels for further details.
Relative humidity over the year
Jurdani 3-Day Forecast
Check the conditions for any month of the year.
Best Time to Visit Jurdani
During the months of May, June, July and August, Jurdani enjoys pleasant weather with average temperatures ranging from 20°C (68°F) to 26°C (80°F). These months are perfect for sightseeing and exploring.Rainfall during this time ranges from 104 mm (4.1 in) in July to 144 mm (5.7 in) in May. This means you can expect a mix of sunny days and occasional showers.
The rainy season falls during September, October, November and December, bringing heavy precipitation. Ready to plan your travels but need destination ideas? Our smart tool recommends places based on the climate conditions you prefer. Start planning with our destination weather tool.


