Isabela Weather & Climate: Best Time to Visit
Average temperatures, rainfall, sunshine and the best time to visit Isabela.
Climate overview of Isabela
Isabela, North Puerto Rico, Puerto Rico, enjoys a steady climate throughout the year, with daytime temperatures typically around 29°C (84°F). August is the warmest month at 31°C (88°F), while February is the coolest at 28°C (82°F).
The city has a wet climate, receiving around 1118 mm (44 in) of rainfall per year. September is the wettest month.
Isabela Weather by Month
Pick a month to see the average temperature, rainfall and sunshine in Isabela — and find the best time to visit.
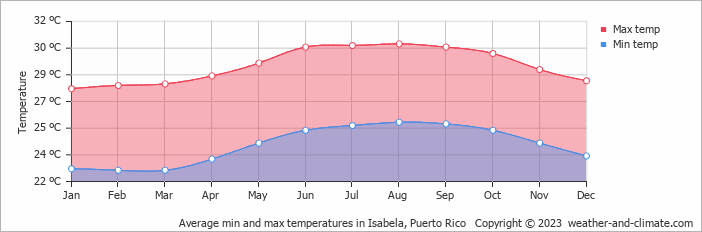
Monthly Temperature in Isabela
The temperature in Isabela remains steady throughout the year, providing a consistently very warm climate. On average, daytime temperatures range from a very warm 31°C (88°F) in August to a comfortable 28°C (82°F) in February.
Nighttime temperatures range from 26°C (79°F) in August to 23°C (73°F) in February.
Check out our detailed temperature page for more information.
Temperature ranges by month
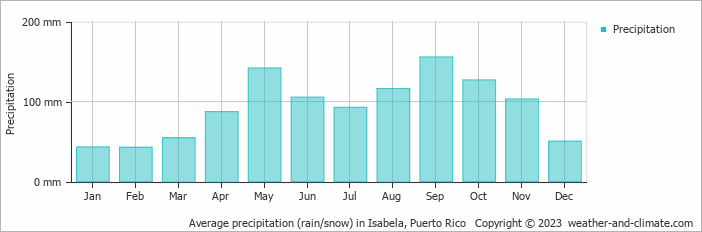
Rainfall in Isabela
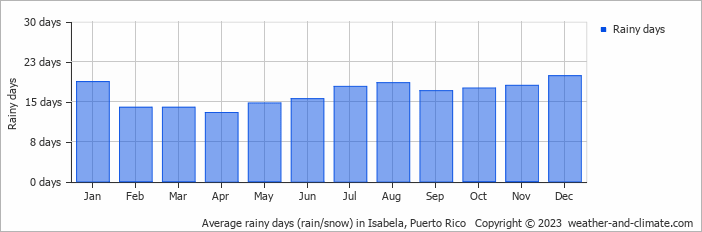
Isabela has a relatively rainy climate with high precipitation levels, averaging 1118 mm (44 in) of rainfall annually. The seasons in Isabela bring significant changes in precipitation. The wettest month, September, receives high rainfall, with an average of 156 mm (6.1 in) of precipitation. This rainfall is distributed across 17 rainy days.
In contrast, the driest month, February, experiences much less rainfall, totaling 43 mm (1.7 in) over 14 rainy days. These distinct seasonal differences provide diverse experiences throughout the year. For more details, please visit our Isabela Precipitation page.
The mean monthly precipitation over the year, including rain, hail, and snow
The average number of days each month with precipitation
Best Time to Visit Isabela
For a more comfortable experience, start your day early when the weather is cooler, or take advantage of the gentle breezes in the late afternoon. Seeking the perfect travel destination for this year? We've created a tool that suggests locations matching your desired weather. Let our weather planner guide your travel decisions.
Frequently asked questions about the climate in Isabela
What is the best time to visit Isabela?
January, February, March, April and December typically offer the most optimal weather in Isabela. In contrast, June, August, September and October tend to have less optimal conditions.
What temperatures can I expect in Isabela?
Daytime highs range from 28°C (82°F) in February to 31°C (88°F) in August. Nighttime lows range from 23°C (73°F) to 26°C (79°F). Temperatures stay relatively stable year-round.
How much rain does Isabela get?
Annual rainfall is around 1118 mm (44 in). September is the wettest month with 156 mm (6.1 in), while February is the driest with 43 mm (1.7 in).
Isabela 3-Day Forecast
Isabela 3-Day Forecast
Isabela on the map
Isabela is highlighted — select any city to see its climate.
Popular this month
Where to go in July — average daytime high across popular destinations.