Iranduba Weather & Climate: Best Time to Visit
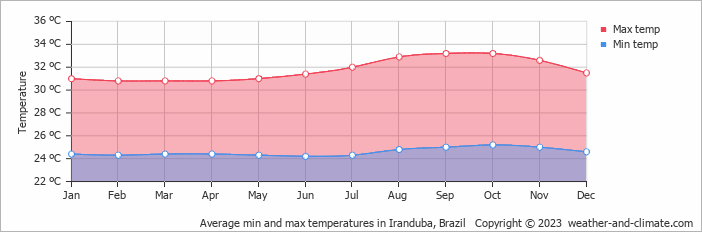
The climate in Iranduba, Amazonas, Brazil, is remarkably consistent, with temperatures year-round averaging 32°C (90°F). The warmest month is September at 33°C (91°F), and the coolest is June at 31°C (88°F).
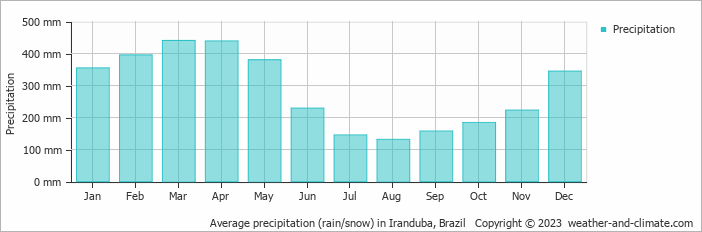
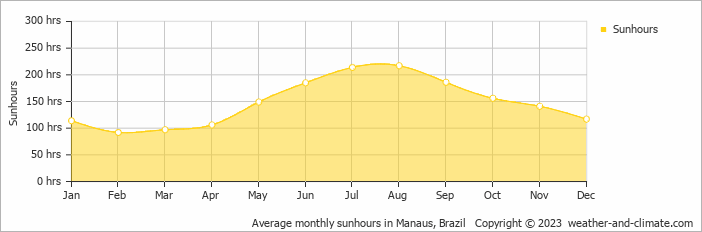
The city receives considerable rainfall, with around 3422 mm (135 in) annually. March is the wettest month. The sunniest month is August, with 7.2 hours of sunshine per day on average.
Monthly Temperature in Iranduba
In Iranduba temperatures are generally consistent throughout the year. Typically, average maximum daytime temperatures range from a very warm 33°C (91°F) in September to a very warm 31°C (88°F) in the coolest month, June.
Nights vary from 25°C (77°F) in September to around 24°C (75°F) during the colder months.
Check out our detailed temperature page for more information.
Temperature ranges by month
Rainfall in Iranduba
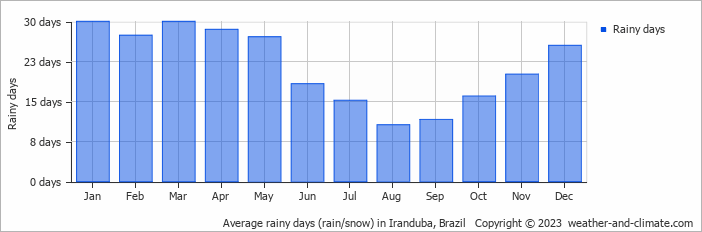
Iranduba experiences significant rainfall throughout the year, averaging 3422 mm (135 in) of precipitation annually. The climate in Iranduba shows significant variation throughout the year. Expect heavy rainfall in March, the wettest month, with an average of 440 mm (17 in) of precipitation over 30 rainy days.
In contrast, the driest month August offers drier and sunnier days, with around 131 mm (5.2 in) of rainfall over 11 rainy days. For more details, please visit our Iranduba Precipitation page.
The mean monthly precipitation over the year, including rain, hail, and snow
The average number of days each month with precipitation
Sunshine Hours in Iranduba
For those who appreciate different seasons, Iranduba serves as an ideal destination. Expect longer, more sun-filled days in August with an average of 7.2 hours of sunshine daily, and embrace the darker days in February, offering only 3.1 hours of daily sunlight.
Visit our detailed sunshine hours page for more information.
Monthly hours of sunshine
Daily hours of sunshine
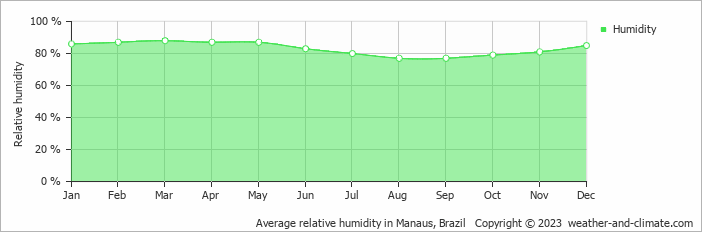
Humidity in Iranduba by Month
The city experiences its highest humidity in March, reaching 88%. In August, the humidity drops to its lowest level at 77%. What does this mean? Read our detailed page on humidity levels for further details.
Relative humidity over the year
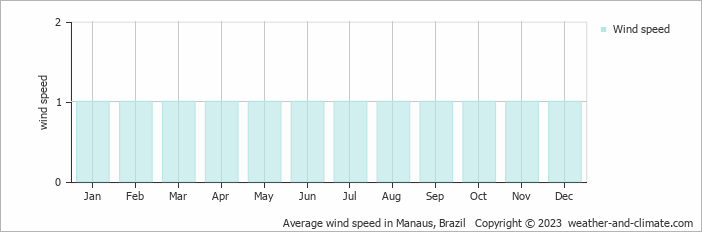
Wind Speed in Iranduba
The mean wind speed varies between 1 m/s (2 knots) and 1 m/s (2 knots) throughout the year. It is lowest in January, February, March, April, May, June, July, August, September, October, November and December and highest during January, February, March, April, May, June, July, August, September, October, November and December. What does this mean?
The mean monthly wind speed over the year (meters per second)
Iranduba 3-Day Forecast
Check the conditions for any month of the year.
Best Time to Visit Iranduba
The warm weather in Iranduba maintains temperatures between 31°C (88°F) and 33°C (91°F) year-round. Plan your visit during July, August and September for drier days and the best conditions to enjoy being outside.To make the most of your visit, consider exploring early in the morning or during the pleasant late afternoon hours when the temperature is most comfortable. Planning your next adventure but unsure where to go? Our climate tool suggests perfect locations tailored to your preferred weather conditions. Discover your ideal travel destination with our weather planner.