Holbox Island Weather & Climate: Best Time to Visit
Average temperatures, rainfall, sunshine and the best time to visit Holbox Island.
Climate overview of Holbox Island
Holbox Island, located in Quintana Roo, Mexico, is a laid-back paradise just north of the Yucatán Peninsula. Known for its car-free charm, bioluminescent waters, and seasonal whale shark tours, Isla Holbox attracts travelers looking for a relaxed, nature-filled trip. The island maintains a fairly consistent, very warm average temperature throughout the year and receives a moderate amount of rainfall. Let’s explore the climate details to give you a complete picture.
Holbox Island Weather by Month
Pick a month to see the average temperature, rainfall and sunshine in Holbox Island — and find the best time to visit.
Monthly Temperature in Holbox Island
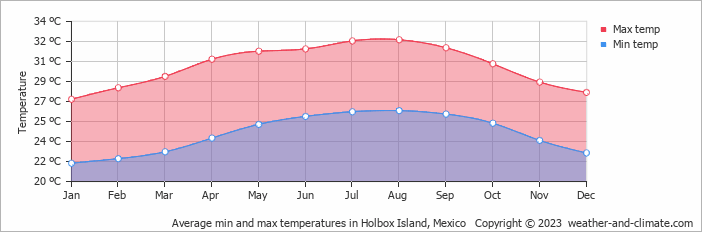
With minimal seasonal shifts, Holbox Island experiences a constant climate year-round. On average, daytime temperatures range from a very warm 32°C (90°F) in August to a comfortable 27°C (81°F) in January.
Nighttime temperatures range from 26°C (79°F) in August to 22°C (72°F) in January.
Check out our detailed temperature page for more information.
Temperature ranges by month
Rainfall in Holbox Island
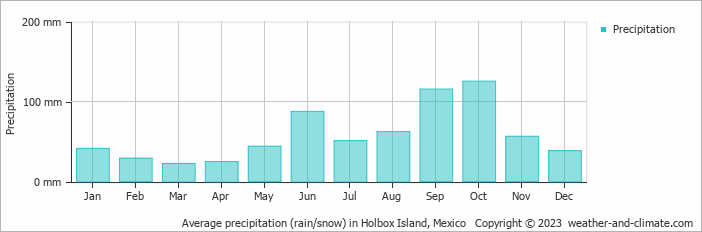
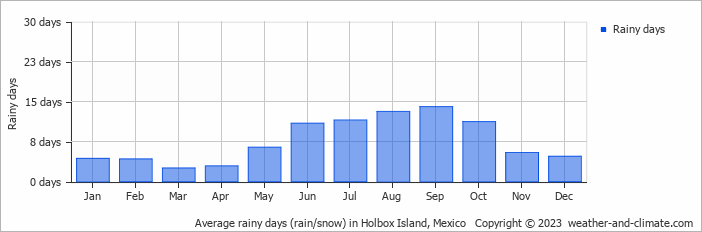
Generally, Holbox Island receives mid-range precipitation levels, with 697 mm (27 in) annually. The seasons in Holbox Island bring significant changes in precipitation. The wettest month, October, receives high rainfall, with an average of 125 mm (4.9 in) of precipitation. This rainfall is distributed across 11 rainy days.
In contrast, the driest month, March, experiences much less rainfall, totaling 22 mm (0.9 in) over 3 rainy days. These distinct seasonal differences provide diverse experiences throughout the year. For more details, please visit our Holbox Island Precipitation page.
The mean monthly precipitation over the year, including rain, hail, and snow
The average number of days each month with precipitation
Sunshine Hours in Holbox Island
Holbox Island enjoys sunny spells year-round. May sees up to 8.8 hours of daily sunshine, perfect for a sunny trip. September, the least sunny month, still offers a generous 6.5 hours of sun despite this cloudier time of the year.
Visit our detailed sunshine hours page for more information.
Monthly hours of sunshine

Daily hours of sunshine
Best Time to Visit Holbox Island
It's smart to plan your activities during the cooler morning hours or take advantage of the refreshing evenings. Need help choosing your next travel destination? We offer a specialized tool that matches you with locations based on your weather preferences. Explore destinations that suit your climate preferences.
Frequently asked questions about the climate in Holbox Island
What is the best time to visit Holbox Island?
January, February, March, November and December typically offer the most optimal weather in Holbox Island. In contrast, September and October tend to have less optimal conditions. Holbox Island has a distinct dry season from February to April.
What temperatures can I expect in Holbox Island?
Daytime highs range from 27°C (81°F) in January to 32°C (90°F) in August. Nighttime lows range from 22°C (72°F) to 26°C (79°F). Temperatures stay relatively stable year-round.
How much rain does Holbox Island get?
Annual rainfall is around 697 mm (27 in). October is the wettest month with 125 mm (4.9 in), while March is the driest with 22 mm (0.9 in).
How sunny is Holbox Island?
Holbox Island receives around 2,723 hours of sunshine per year. May is the sunniest month with 264 hours, while September is the cloudiest with just 195 hours. Overall, Holbox Island enjoys abundant sunshine.
Holbox Island 3-Day Forecast
Holbox Island 3-Day Forecast
Holbox Island on the map
Holbox Island is highlighted — select any city to see its climate.
Popular this month
Where to go in July — average daytime high across popular destinations.
Bucket list
Need travel inspiration? Check out our bucket list articles and be inspired.
 Explore the Majestic Copper Canyons of Mexico
Explore the vast Copper Canyons in Chihuahua, Mexico—larger than the Grand Canyon. Discover scenic train rides, hikes, and the Tarahumara people.
These are the most beautiful Mayan ruins and Mayan temples in Mexico
Mexico is a destination where you can immerse yourself in ancient cultures and civilizations. In this article we have listed our favorite Mayan ruins.
Tips, to-do's and nicest restaurants in Mexico City
Mexico City, one of the most famous and notorious cities of the world. The best time to visit is between March and May, but it can be visited year round.
Zihuatanejo: A Pacific paradise with beautiful beaches
Zihuatanejo has some of Mexico's top beaches. Unlike other off-the-beaten-path destinations in Mexico, Zihua is very accessible and sustainable.