Holbox Island Monthly Rainfall & Precipitation
This page shows both the average monthly rainfall and the number of rainy days in Holbox Island, Quintana Roo, Mexico. These values are calculated using 30 years of data (1990–2020) to ensure accuracy. Now, let's explore all the details to give you a full picture.
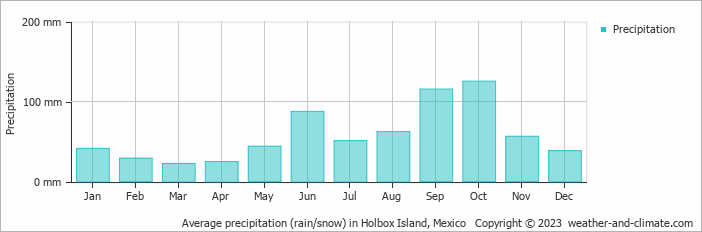
Generally, Holbox Island experiences moderate precipitation patterns, averaging 697 mm (27 in) yearly. However, this average masks significant seasonal variation, including a distinct dry season during certain months that are clearly visible in our monthly breakdown below.
Monthly Rainfall & Rainy Days
Monthly Precipitation Levels
The average number of days each month with precipitation (> 0.2 mm (0.01 in))
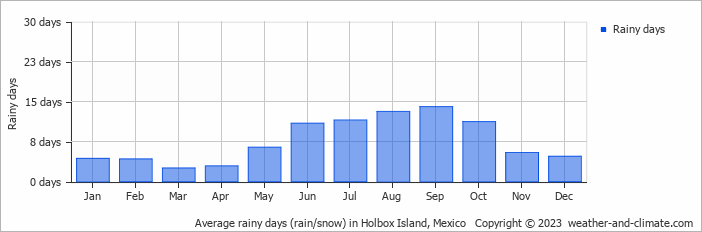
The climate in Holbox Island shows significant variation throughout the year. Expect 125 mm (4.9 in) of precipitation during the wettest month October, distributed over 11 rainy days.
In contrast, March offers drier and sunnier days, with around 22 mm (0.9 in) of rainfall over 3 rainy days.
October, the wettest month, has a maximum daytime temperature of 30°C (86°F). The city receives 217 hours of sunshine in this period. During the driest month March you can expect a temperature of 29°C (84°F). For more detailed insights into the city's temperatures, visit our Holbox Island Temperature page.
Explore Holbox Island's Historical Precipitation: 1976-2026
Browse day-by-day precipitation records for Holbox Island spanning 51 years. Select any month and year to see actual rainfall and snowfall recorded on each day.
Annual Rainfall in Mexico: City Comparison
The map below shows the annual precipitation across Mexico. You can also select the different months in case you are interested in a specific month.
Holbox Island vs World: Rainfall Compared
Holbox Island's average annual precipitation is 697 mm (27 in). Let's compare this to some popular worldwide tourist destinations:
Seville, Spain, experiences 541 mm (21 in) of rainfall annually, with wet winters and dry summers typical of southern Spain.
In Seoul, South Korea, the average annual precipitation is 1237 mm (49 in), with most rain falling during the summer monsoon season.
In Brisbane, Australia, the annual precipitation is 979 mm (39 in), making it wetter than Sydney.
Mumbai, India, experiences a tropical monsoon climate with 1860 mm (73 in) of annual rainfall, with the majority of precipitation happening during the monsoon season from June to September.
Precipitation amounts are measured using specific gauges installed at weather stations, collecting both rain and snow and any other type of precipitation. Rainfall is measured directly in millimeters, while that from snow and ice is obtained by melting it. Automated systems often incorporate heaters to make this easier.
Information from these stations is transmitted via Wi-Fi, satellite, GPS, or telephone connections to central monitoring networks. This information is immediately updated and integrated into weather models and forecasts.
Precipitation has a very strong role in determining the local climate and ecosystem:
- Changing Rainfall Patterns: Global warming causes drastic changes in the patterns of rainfall. Some areas have been experiencing increased frequency and intensity of rainfall, while other areas experience longer dry spells or even droughts.
- Local Impacts: Many regions are experiencing heavier rainfall in the winter months and drier, hotter summers. This affects agriculture, water resources, and ecosystems.
- Mawsynram in India is noted as being the wettest place on earth, with over 11 meters (36 feet) of rain falling every year.
- In contrast, Antofagasta in Chile is among the driest places on the planet, getting less than 0.1mm (0.004 inches) per year, with some years recording virtually no rainfall.
- Nearly 1,650 thunderstorm cells are estimated over the planet at any given time.
For more detailed information about Holbox Island's weather, including sunshine hours, humidity levels, and temperature data, visit our Holbox Island Climate page.
Holbox Island Weather by Month
Pick a month to see the average temperature, rainfall and sunshine in Holbox Island - and find the best time to visit.
Holbox Island 3-Day Forecast
Temperature Rainfall Sunshine
See the full Holbox Island climate overview or explore weather in Mexico.
Popular this month
Where to go in July - average daytime high across popular destinations.
Bucket list
Need travel inspiration? Check out our bucket list articles and be inspired.
 Explore the Majestic Copper Canyons of Mexico
Explore the vast Copper Canyons in Chihuahua, Mexico—larger than the Grand Canyon. Discover scenic train rides, hikes, and the Tarahumara people.
These are the most beautiful Mayan ruins and Mayan temples in Mexico
Mexico is a destination where you can immerse yourself in ancient cultures and civilizations. In this article we have listed our favorite Mayan ruins.
Tips, to-do's and nicest restaurants in Mexico City
Mexico City, one of the most famous and notorious cities of the world. The best time to visit is between March and May, but it can be visited year round.
Zihuatanejo: A Pacific paradise with beautiful beaches
Zihuatanejo has some of Mexico's top beaches. Unlike other off-the-beaten-path destinations in Mexico, Zihua is very accessible and sustainable.