El Serrat Weather & Climate: Best Time to Visit
Average temperatures, rainfall, sunshine and the best time to visit El Serrat.
Climate overview of El Serrat
El Serrat, Andorra, experiences significant temperature variation throughout the year. Summers bring daytime highs of 21°C (70°F) in August, while winters cool to 3°C (37°F) in January.
Rain/snowfall is high, totalling around 1159 mm (46 in) per year. May is the wettest month and December the driest.
El Serrat Weather by Month
Pick a month to see the average temperature, rainfall and sunshine in El Serrat — and find the best time to visit.
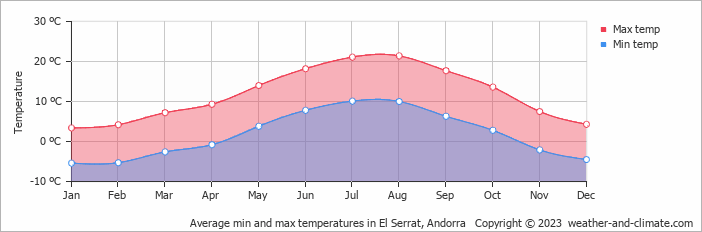
Monthly Temperature in El Serrat
Depending on the time of the year, temperatures range from pleasant to chilly in El Serrat. Average maximum daytime temperatures range from a pleasant 21°C (70°F) in August, the warmest time of the year, to a chilly 3°C (37°F) during cooler months like January.
At night, you can expect temperatures ranging from 10°C (50°F) in August to around -5°C (23°F) during January.
Check out our detailed temperature page for more information.
Temperature ranges by month
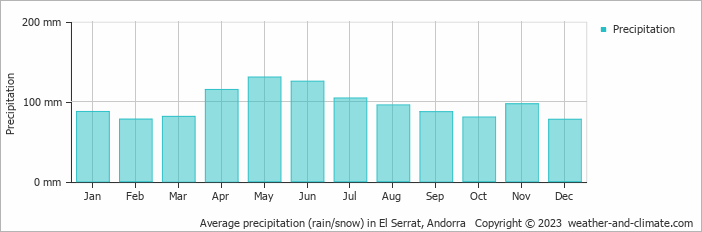
Rainfall in El Serrat
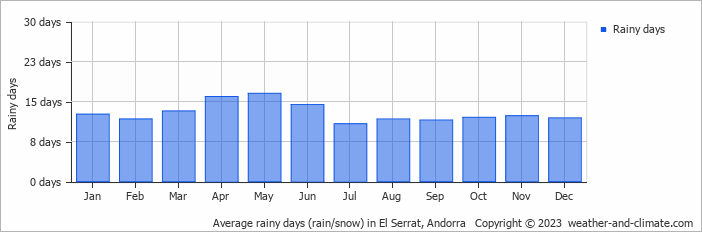
El Serrat has a relatively rain/snowy climate with high precipitation levels, averaging 1159 mm (46 in) of rain/snowfall annually. While rainfall varies throughout the year, each season offers its own charm. May brings wetter days averaging 130 mm (5.1 in) of precipitation, spread over 17 rainy days.
In contrast, the driest month December experiences a drier climate, with about 78 mm (3.1 in) of snow/rainfall spread across 12 snowy/rainy days. For more details, please visit our El Serrat Precipitation page.
The mean monthly precipitation over the year, including rain, hail, and snow
The average number of days each month with precipitation
Best Time to Visit El Serrat
Rainfall during this time ranges from 96 mm (3.8 in) in August to 125 mm (4.9 in) in June. This means you can expect a mix of sunny days and occasional showers. Looking for inspiration on where to travel this year? We have a tool that recommends destinations based on your ideal conditions. Find out where to go with our weather planner.
Frequently asked questions about the climate in El Serrat
What is the best time to visit El Serrat?
August typically offers the most optimal weather in El Serrat. In contrast, January, February, March, April, November and December tend to have less optimal conditions.
What temperatures can I expect in El Serrat?
Daytime highs range from 3°C (37°F) in January to 21°C (70°F) in August. Nighttime lows range from -5°C (23°F) to 10°C (50°F). Temperatures vary considerably through the year.
How much rain does El Serrat get?
Annual rainfall is around 1159 mm (46 in). May is the wettest month with 130 mm (5.1 in), while December is the driest with 78 mm (3.1 in).
El Serrat 3-Day Forecast
El Serrat 3-Day Forecast
El Serrat on the map
El Serrat is highlighted — select any city to see its climate.
Popular this month
Where to go in June — average daytime high across popular destinations.