Arinsal Weather & Climate: Best Time to Visit
Average temperatures, rainfall, sunshine and the best time to visit Arinsal.
Climate overview of Arinsal
Temperatures in Arinsal, Andorra, vary greatly throughout the year. August is the hottest month at 21°C (70°F), while January is the coldest at 3°C (37°F).
The city receives considerable rain/snowfall, with around 1090 mm (43 in) annually. May is the wettest month.
Arinsal Weather by Month
Pick a month to see the average temperature, rainfall and sunshine in Arinsal — and find the best time to visit.
Monthly Temperature in Arinsal
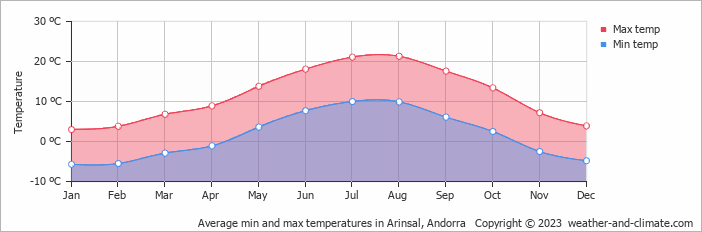
The climate in Arinsal is known for significant temperature differences throughout the year, making the weather dynamic. Typically, average maximum daytime temperatures range from a pleasant 21°C (70°F) in August to a chilly 3°C (37°F) in the coolest month, January.
Nights vary from 10°C (50°F) in August to around -6°C (21°F) during the colder months.
Check out our detailed temperature page for more information.
Temperature ranges by month
Rainfall in Arinsal
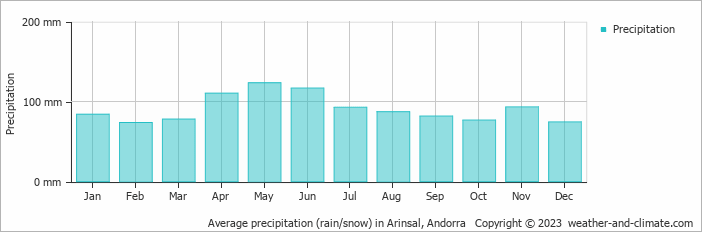
Arinsal has a notably wet climate with abundant precipitation, recording 1090 mm (43 in) of rain/snowfall per year. Arinsal offers a pleasant mix of wetter and slightly drier months. The difference in precipitation between the wettest month May (123 mm (4.8 in)) and the driest month February (74 mm (2.9 in)) is not too significant. For more details, please visit our Arinsal Precipitation page.
The mean monthly precipitation over the year, including rain, hail, and snow
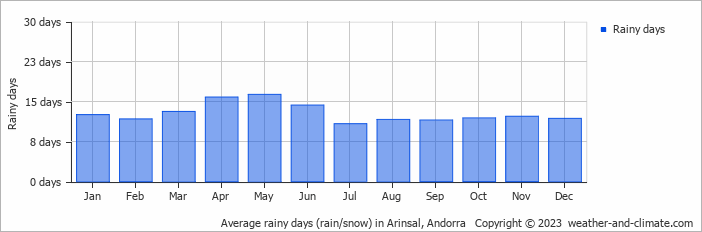
The average number of days each month with precipitation
Best Time to Visit Arinsal
Frequently asked questions about the climate in Arinsal
What is the best time to visit Arinsal?
July and August typically offer the most optimal weather in Arinsal. In contrast, January, February, March, April, November and December tend to have less optimal conditions.
What temperatures can I expect in Arinsal?
Daytime highs range from 3°C (37°F) in January to 21°C (70°F) in August. Nighttime lows range from -6°C (21°F) to 10°C (50°F). Temperatures vary considerably through the year.
How much rain does Arinsal get?
Annual rainfall is around 1090 mm (43 in). May is the wettest month with 123 mm (4.8 in), while February is the driest with 74 mm (2.9 in).
Arinsal 3-Day Forecast
Arinsal 3-Day Forecast
Arinsal on the map
Arinsal is highlighted — select any city to see its climate.
Popular this month
Where to go in June — average daytime high across popular destinations.