Ditchling Climate by Month
The temperature in Ditchling can vary greatly throughout the year.
The temperatures shift from pleasant
to cold.
It receives mid-range precipitation levels.
Let’s explore the climate details in depth to provide you with a complete overview.
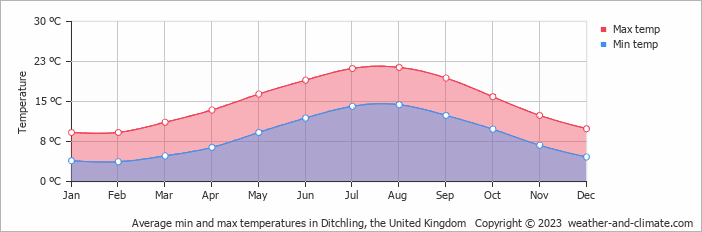
Average day and night temperature
Depending on the time of the year, temperatures range from pleasant to chilly in Ditchling. Average daytime temperatures range from a pleasant 21°C in August, the warmest time of the year, to a chilly 9°C during cooler months like February. At night, temperatures typically average around 4°C during these months.
The mean minimum and maximum temperatures throughout the year
Precipitation and rainy days
Generally, Ditchling has a moderate amount of precipitation, averaging 815 mm of rainfall annually. While rainfall varies throughout the year, each season offers its own charm. November brings wetter days averaging 92 mm of precipitation, spread over 17 rainy days. In contrast, March experiences a drier climate, with about 52 mm of rainfall spread across 15 rainy days.The mean monthly precipitation over the year, including rain, hail and snow
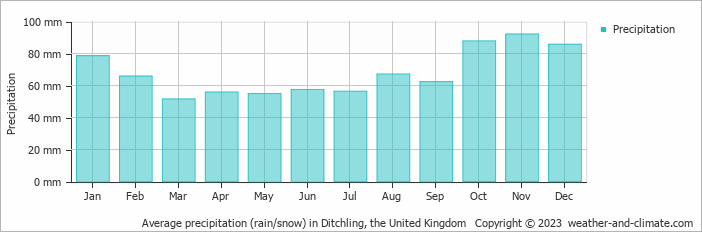
The average number of days each month with precipitation

Average water temperature
The mean water temperature over the year in Ditchling ranges from 8°C in March to 18°C in September.
Water temperature over the year

The best time of year to visit Ditchling in the United Kingdom
During the months of July and August you are most likely to experience good weather with pleasant average temperatures that fall between 20°C and 26°C.Other facts from our historical weather data:
August has an average maximum temperature of 21°C and is the warmest month of the year.
The coldest month is February with an average maximum temperature of 9°C.
November tops the wettest month list with 92 mm of rainfall.
March is the driest month with 52 mm of precipitation.
No idea where to travel to this year? We have a tool that recommends destinations based on your ideal conditions. Find out where to go with our weather planner.


