Cullipool Weather & Climate: Best Time to Visit
The climate in Cullipool, Strathclyde, United Kingdom, sees a moderate range of temperatures across the year, from 16°C (61°F) in August down to 8°C (46°F) in February.
The city receives considerable rainfall, with around 2388 mm (94 in) annually. December is the wettest month. It has a distinct rainy season from August to March. The sunniest month is May, with 6.3 hours of sunshine per day on average.
Monthly Temperature in Cullipool
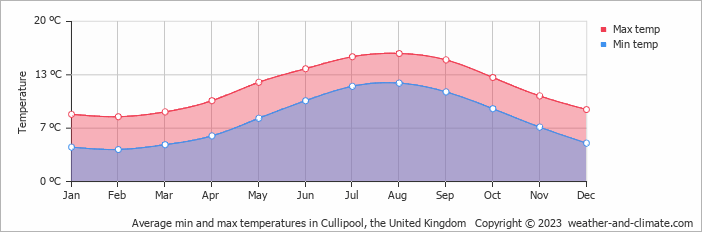
The climate in Cullipool experiences moderate temperature changes, with mild shifts between seasons. Typically, average maximum daytime temperatures range from a moderate 16°C (61°F) in August to a chilly 8°C (46°F) in the coolest month, February.
Nights vary from 12°C (54°F) in August to around 4°C (39°F) during the colder months.
Check out our detailed temperature page for more information.
Temperature ranges by month
Rainfall in Cullipool
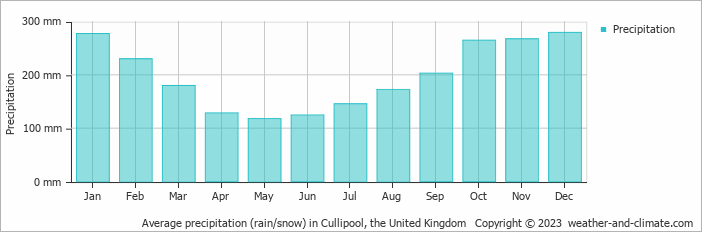
Cullipool experiences significant rainfall throughout the year, averaging 2388 mm (94 in) of precipitation annually. The climate in Cullipool shows significant variation throughout the year. Expect heavy rainfall in December, the wettest month, with an average of 279 mm (11 in) of precipitation over 23 rainy days.
In contrast, the driest month May offers drier and sunnier days, with around 118 mm (4.6 in) of rainfall over 17 rainy days. For more details, please visit our Cullipool Precipitation page.
The mean monthly precipitation over the year, including rain, hail, and snow
The average number of days each month with precipitation

Sunshine Hours in Cullipool
For those who appreciate different seasons, Cullipool serves as an ideal destination. Expect longer, more sun-filled days in May with an average of 6.3 hours of sunshine daily, and embrace the darker days in December, offering only 1.0 hours of daily sunlight.
Visit our detailed sunshine hours page for more information.
Monthly hours of sunshine

Daily hours of sunshine
Cullipool 3-Day Forecast
Check the conditions for any month of the year.
Best Time to Visit Cullipool
The best time to visit Cullipool is during August, when the weather provides comfortable temperatures of 16°C (61°F). With rainfall of 172 mm (6.8 in), you can expect generally favorable weather for your visit during this period.Be prepared for heavier rainfall during January, February, March, August, September, October, November and December, the wettest period of the year. Wondering where to travel based on your weather preferences? Our recommendation tool helps you find destinations with your ideal climate conditions. Use our weather planner to find your perfect destination.


