Chincha Alta Weather and Climate: A Comprehensive Guide
Chincha Alta has relatively stable weather with warm temperatures.
The area is known for its low rainfall.
Now, let’s explore all the climate details to give you a full picture.
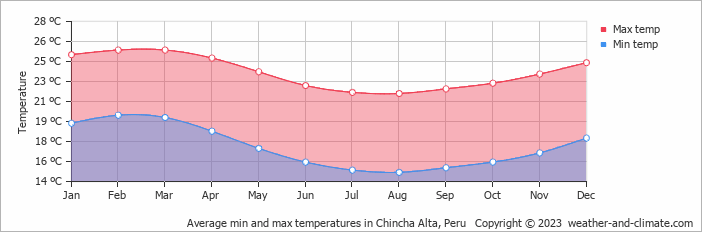
Average maximum day and minimum night temperature
In Chincha Alta temperatures are generally consistent throughout the year. Average maximum daytime temperatures range from a comfortable 26°C in February, the warmest time of the year, to a pleasant 22°C during cooler months like August.
At night, temperatures typically drop to an average of around 15°C during these months. Check out our detailed temperature page for more information.Temperature ranges by month
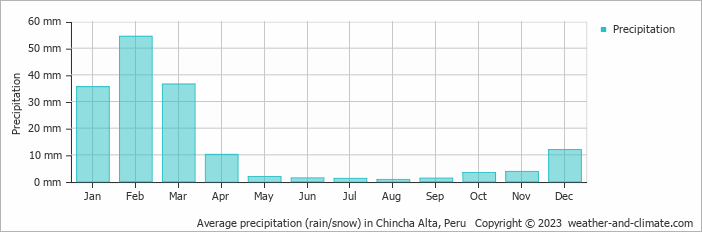
Precipitation and rainy days
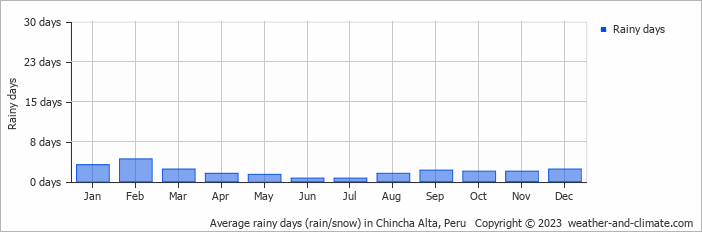
Chincha Alta sits in an arid zone with minimal moisture, averaging 162 mm of rainfall per year. Significant seasonal changes in precipitation occur throughout the year. During the wetter season, February receives moderate rainfall, averaging 54 mm of precipitation, recorded across 4 rainy days. In contrast, the drier season, August brings less rainfall, with 0.7 mm over 2 rainy days. For more details, please visit our Chincha Alta Precipitation page.The mean monthly precipitation over the year, including rain, hail and snow
The average number of days each month with precipitation
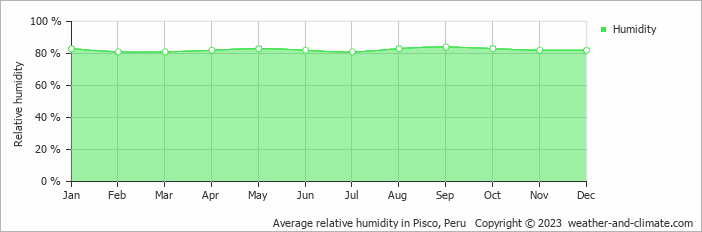
Average humidity
The city experiences its highest humidity in September, reaching 84%. In February, the humidity drops to its lowest level at 81%. What does this mean? Read our detailed page on humidity levels for further details.
Relative humidity over the year
almost clear and no rain clear and no rain almost clear and no rainForecast for Chincha Alta
 3 m/s
3 m/s![]() 4 m/s
4 m/s![]() 3 m/s
3 m/s![]()
Select a Month of Interest
Check the conditions for any month of the year.
The best time of year to visit Chincha Alta in Peru
Other facts from our historical weather data:March has an average maximum temperature of 26°C and is the warmest month of the year.
The coldest month is August with an average maximum temperature of 22°C.
February tops the wettest month list with 54 mm of rainfall.
August is the driest month with 1 mm of precipitation.
No idea where to travel to this year? We have a tool that recommends destinations based on your ideal conditions. Find out where to go with our weather planner.


