Cerritos Weather & Climate: Best Time to Visit
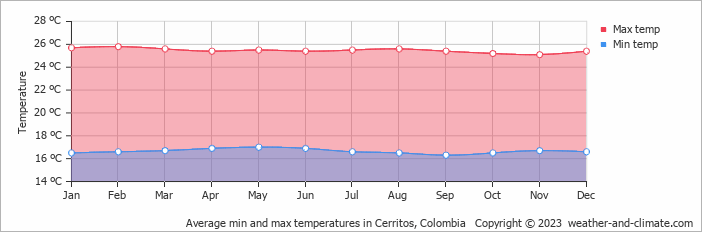
Cerritos, Risaralda, Colombia, has a stable climate with little temperature variation across the year. Average daytime temperatures hover around 25°C (77°F), peaking in February at 26°C (79°F) and dipping in September to 25°C (77°F).
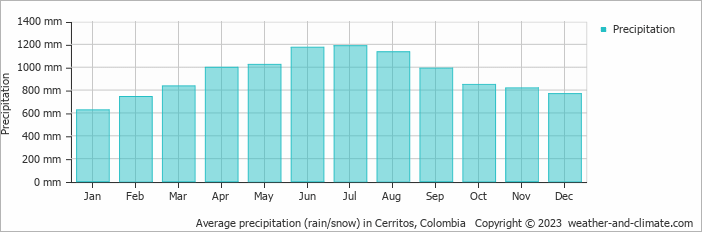
The city has a wet climate, receiving around 11140 mm (439 in) of rainfall per year. July is the wettest month.
Monthly Temperature in Cerritos
With minimal seasonal shifts, Cerritos experiences a constant climate year-round. On average, daytime temperatures range from a comfortable 26°C (79°F) in February to a comfortable 25°C (77°F) in September.
Nighttime temperatures range from 17°C (63°F) in February to 16°C (61°F) in September.
Check out our detailed temperature page for more information.
Temperature ranges by month
Rainfall in Cerritos
Cerritos has a notably wet climate with abundant precipitation, recording 11140 mm (439 in) of rainfall per year. The amount of precipitation varies moderately throughout the year. The wettest month, July, sees around 1187 mm (47 in) of rainfall, perfect for those who enjoy a bit of rain now and then. The driest month, January, still receives a respectable 626 mm (25 in) of rainfall. For more details, please visit our Cerritos Precipitation page.
The mean monthly precipitation over the year, including rain, hail, and snow
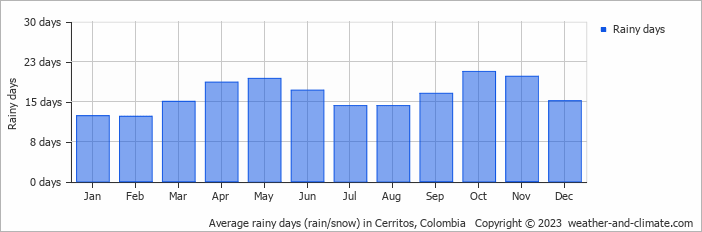
The average number of days each month with precipitation
Cerritos 3-Day Forecast
Check the conditions for any month of the year.
Best Time to Visit Cerritos
Cerritos has a consistently rainy climate year-round, with every month experiencing heavy precipitation exceeding 160 mm (6.3 in). There is no traditional dry season to recommend for visits. January stands out as the least wet month with 626 mm (25 in) of rainfall.Plan your visit with the expectation of frequent rain and pack accordingly. The year-round moisture creates beautiful green surroundings, but requires waterproof preparation. Looking for inspiration on where to travel this year? We have a tool that recommends destinations based on your ideal conditions. Find out where to go with our weather planner.


