

















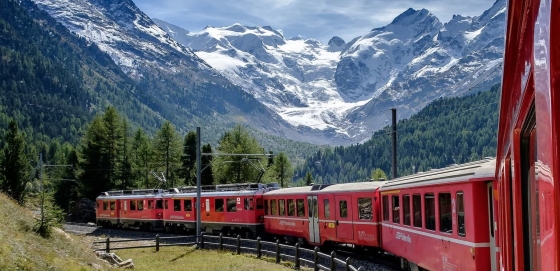
 The 5 most scenic train journeys in Switzerland
Explore Switzerland's top 5 train journeys, featuring breathtaking Alpine views and engineering marvels like the Glacier Express and Bernina Express.
Average temperatures, rainfall, sunshine and the best time to visit Cavigliano.
 –
–
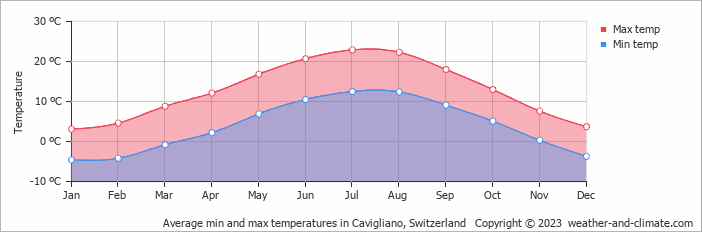
Cavigliano, Canton of Ticino, Switzerland, sees big temperature differences between seasons, with July peaking at 23°C (73°F) and January dropping to 3°C (37°F).
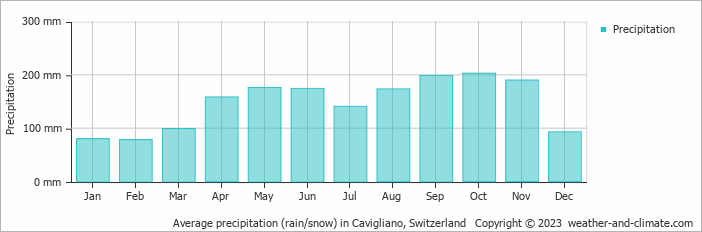
Rain/snowfall is high, totalling around 1763 mm (69 in) per year. October is the wettest month and February the driest. The city also experiences a distinct rainy season from August to November, with warm summers and cold winters. July is the sunniest month, averaging 8.9 hours of sunshine per day.
Pick a month to see the average temperature, rainfall and sunshine in Cavigliano - and find the best time to visit.
Visitors to Cavigliano can expect significant temperature changes throughout the year. Average maximum daytime temperatures range from a comfortable 23°C (73°F) in July, the warmest time of the year, to a chilly 3°C (37°F) during cooler months like January.
At night, you can expect temperatures ranging from 13°C (55°F) in July to around -5°C (23°F) during January.
Check out our detailed temperature page for more information.
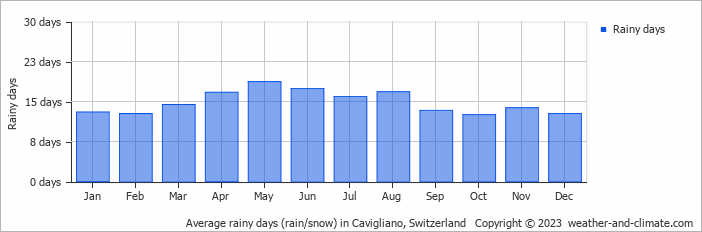
Cavigliano is known for its substantial rain/snowfall, with annual precipitation reaching 1763 mm (69 in). Significant seasonal changes in precipitation occur throughout the year. In the wettest month, October it receives heavy rainfall, averaging 203 mm (8 in) of precipitation, recorded across 13 rainy days. In contrast, the driest month February brings less snow/rainfall, with 78 mm (3.1 in) over 13 snowy/rainy days. For more details, please visit our Cavigliano Precipitation page.
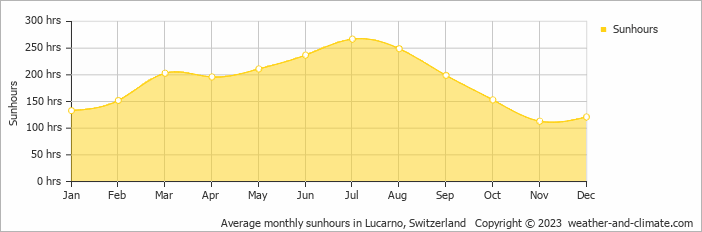
Seasonal changes in sunshine hours are quite dramatic in Cavigliano. While July receives considerable daily sunshine with up to 8.9 hours, November marks the darkest time of the year, where sunshine is scarce with only 3.8 hours of sunlight per day.
Visit our detailed sunshine hours page for more information.
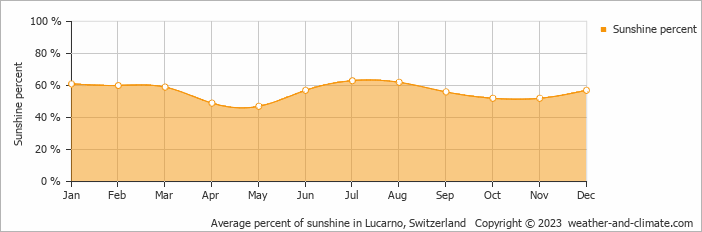
The relative humidity is high throughout the year in Cavigliano.
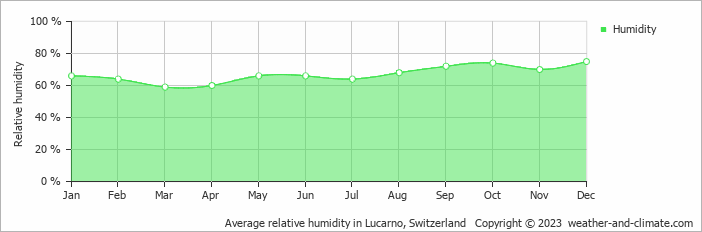
The city experiences its highest humidity in December, reaching 75%. In March, the humidity drops to its lowest level at 59%. What does this mean? Read our detailed page on humidity levels for further details.
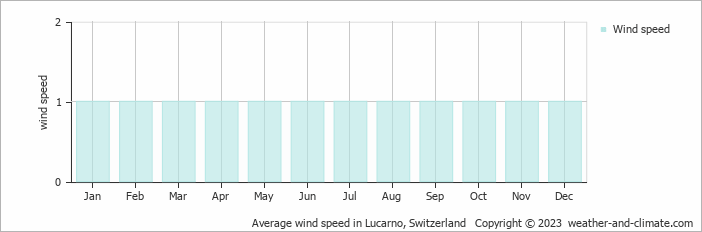
The mean wind speed varies between 1 m/s (2 knots) and 1 m/s (2 knots) throughout the year. It is lowest in January, February, March, April, May, June, July, August, September, October, November and December and highest during January, February, March, April, May, June, July, August, September, October, November and December. What does this mean?
Monthly ratings reflect general weather comfort, based on daytime temperature and rainfall. Swimming and winter conditions are highlighted separately where relevant.
June, July and August typically offer the most optimal weather in Cavigliano. In contrast, January, February, March, April, October, November and December tend to have less optimal conditions. Cavigliano has a distinct rainy season from August to November, with warm summers and cold winters.
Daytime highs range from 3°C (37°F) in January to 23°C (73°F) in July. Nighttime lows range from -5°C (23°F) to 13°C (55°F). Temperatures vary considerably through the year.
Annual rainfall is around 1763 mm (69 in). October is the wettest month with 203 mm (8 in), while February is the driest with 78 mm (3.1 in).
Cavigliano receives around 2,234 hours of sunshine per year. July is the sunniest month with 267 hours, while November is the cloudiest with just 113 hours. Overall, Cavigliano enjoys abundant sunshine.
Cavigliano is highlighted - select any city to see its climate.
Where to go in September - average daytime high across popular destinations.
Zürich 20°C (68°F) Crans-Montana15°C (59°F) Engelberg
 15°C (59°F) Nendaz15°C (59°F) Saas-Fee12°C (54°F) Davos13°C (55°F) Grindelwald13°C (55°F) Zermatt11°C (52°F)
 Need travel inspiration? Check out our bucket list articles and be inspired.
The 5 most scenic train journeys in Switzerland
Explore Switzerland's top 5 train journeys, featuring breathtaking Alpine views and engineering marvels like the Glacier Express and Bernina Express.
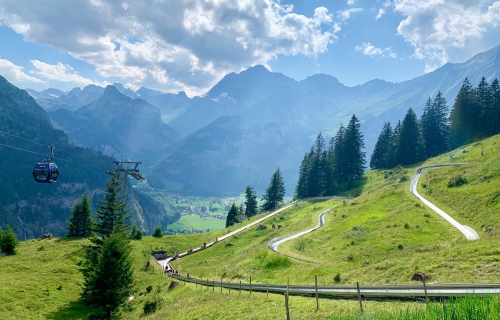 You'll love this Mountain roller coaster
Hotel Oeschinensee’s mountain coaster is a summer toboggan that you want to add to your bucket list. You'll get in your cart, sit down and fly across the track while enjoying the beautiful mountain scenery around you.
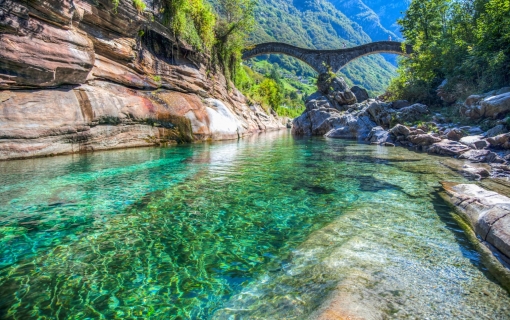 The Verzasca Valley
You can visit the Verzasca Valley in any season. It's an amazing place for swimming and it is a paradise for hikers. A must see for the bucket list.
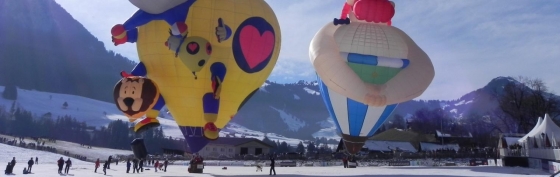 Balloon at Chateau D'oex
If you are looking for a special place to visit in Europe in January we recommend visiting the annual balloon festival in Château-d'Oex, Switzerland.