Cascina Weather and Climate: A Comprehensive Guide
The climate in Cascina is marked by big temperature swings throughout the year.
Temperatures range from warm during the warmest months
to cold in the cooler months.
It also has a notably wet climate with much precipitation.
Now, let’s explore all the climate details to give you a full picture.
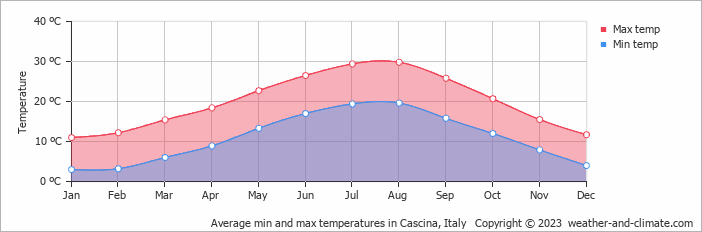
Average maximum day and minimum night temperature
In Cascina, temperatures differ significantly between summer and winter months. Average maximum daytime temperatures range from a comfortable 30°C in August, the warmest time of the year, to a chilly 11°C during cooler months like January.
At night, temperatures typically drop to an average of around 3°C during these months.Check out our detailed temperature page for more information.
Temperature ranges by month
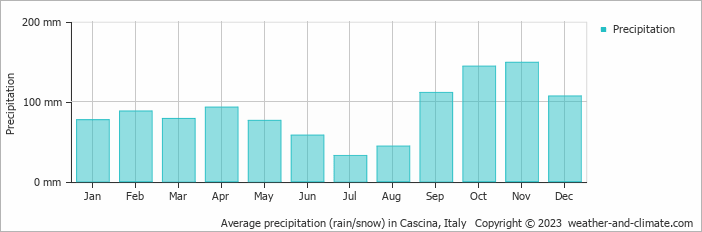
Precipitation and rainy days
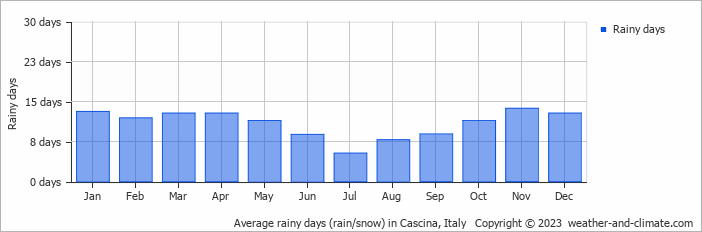
Cascina experiences significant rainfall throughout the year, averaging 1057 mm of precipitation annually. Significant seasonal changes in precipitation occur throughout the year. During the wetter season, November receives high rainfall, averaging 149 mm of precipitation, recorded across 14 rainy days. In contrast, the drier season, July brings less rainfall, with 32 mm over 5 rainy days. For more details, please visit our Cascina Precipitation page.
The mean monthly precipitation over the year, including rain, hail and snow
The average number of days each month with precipitation
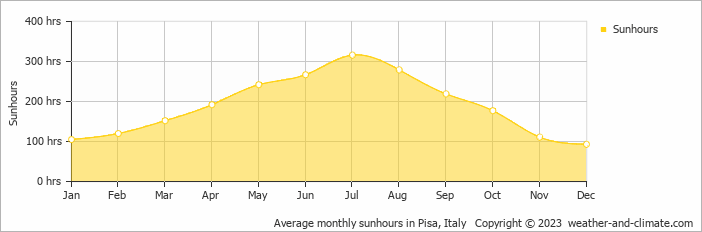
Sunshine over the year
Seasonal changes in sunshine hours are quite dramatic in Cascina. While July receives considerable daily sunshine with up to 10.5 hours, December marks the darkest time of the year, where sunshine is scarce with only 3.1 hours of sunlight per day.
Visit our detailed sunshine hours page for more information.
Monthly hours of sunshine
Daily hours of sunshine
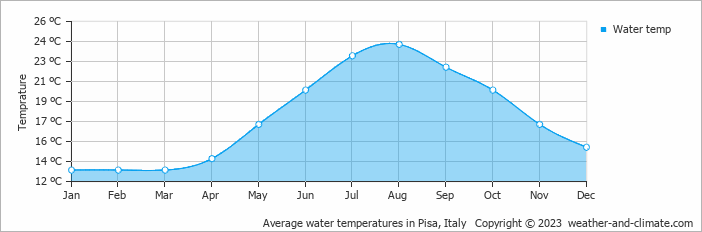
Average water temperature
The mean water temperature over the year ranges from 13°C in January to 24°C in August.
Water temperature over the year
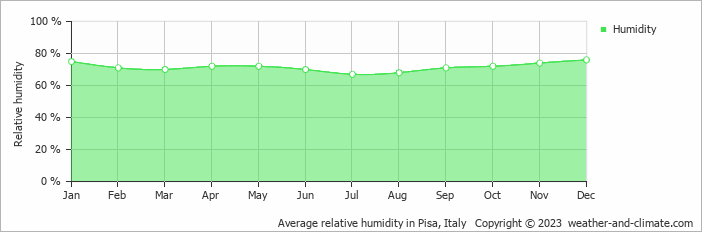
Average humidity
The relative humidity is high throughout the year in Cascina.
The city experiences its highest humidity in December, reaching 76%. In July, the humidity drops to its lowest level at 67%. What does this mean? Read our detailed page on humidity levels for further details.
Relative humidity over the year
Forecast for Cascina


Select a Month of Interest
Check the conditions for any month of the year.
The best time of year to visit Cascina in Italy
During the months of May, September and October you are most likely to experience good weather with pleasant average temperatures that fall between 20°C and 26°C.Other facts from our historical weather data:
The hottest season / summer takes place in June, July, August and September.
August has an average maximum temperature of 30°C and is the warmest month of the year.
The coldest month is January with an average maximum temperature of 11°C.
November tops the wettest month list with 149 mm of rainfall.
July is the driest month with 32 mm of precipitation.
July is the sunniest month with an average of 316 hours of sunshine.
No idea where to travel to this year? We have a tool that recommends destinations based on your ideal conditions. Find out where to go with our weather planner.


