Average monthly water temperature in Cascina, Italy
On this page you find the mean water temperature over the year in Cascina (Tuscany), Italy. Take a closer look at the water temperature patterns and what they mean for swimming and recreation.
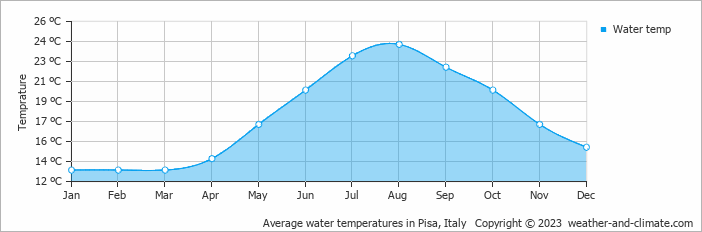
Data from: Pisa, Italy (13 KM, 8 Miles).
In Cascina, the water undergoes seasonal changes. The warmest month is August, with an average water temperature of 24°C (75°F).
The coldest water temperature month, March, has an average temperature of 13°C (55°F). It may not be the ideal time for a swim.


