Camaragibe Weather & Climate: Best Time to Visit
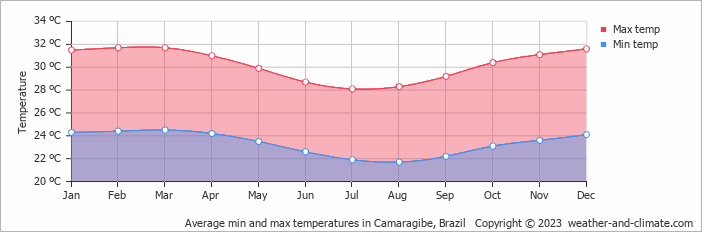
With consistently stable weather, Camaragibe, Pernambuco, Brazil, sees little seasonal temperature change. Daytime highs average 30°C (86°F), ranging from 32°C (90°F) in February to 28°C (82°F) in August.
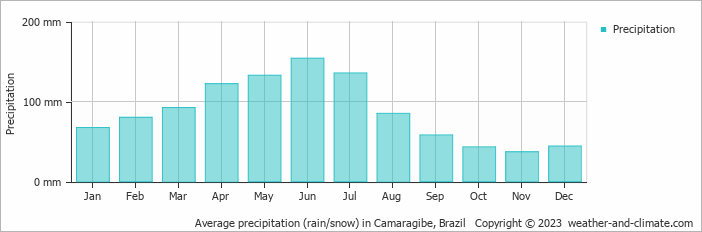
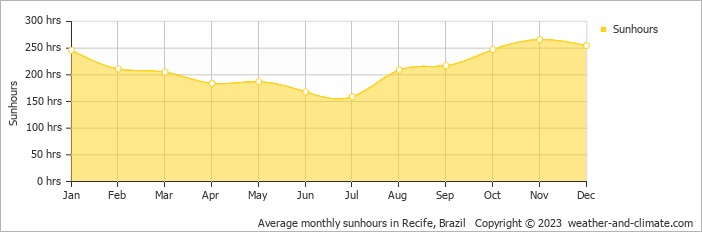
Rainfall is high, totalling around 1051 mm (41 in) per year. June is the wettest month and November the driest. The most sunshine falls in November, with an average of 8.9 hours of daily sunshine.
Monthly Temperature in Camaragibe
The climate in Camaragibe remains fairly constant, offering very warm temperatures throughout the year. Average maximum daytime temperatures range from a very warm 32°C (90°F) in February, the warmest time of the year, to a comfortable 28°C (82°F) during cooler months like August.
At night, you can expect temperatures ranging from 25°C (77°F) in February to around 22°C (72°F) during August.
Check out our detailed temperature page for more information.
Temperature ranges by month
Rainfall in Camaragibe
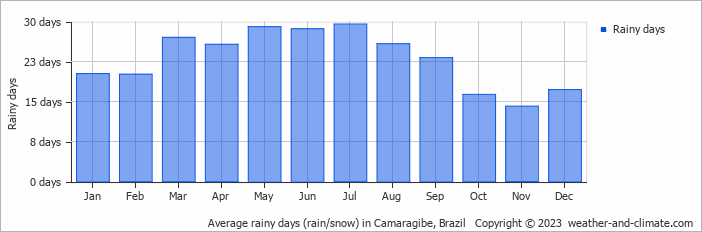
Camaragibe is known for its substantial rainfall, with annual precipitation reaching 1051 mm (41 in). Significant seasonal changes in precipitation occur throughout the year. In the wettest month, June it receives high rainfall, averaging 154 mm (6.1 in) of precipitation, recorded across 29 rainy days. In contrast, the driest month November brings less rainfall, with 37 mm (1.5 in) over 14 rainy days. For more details, please visit our Camaragibe Precipitation page.
The mean monthly precipitation over the year, including rain, hail, and snow
The average number of days each month with precipitation
Sunshine Hours in Camaragibe
Seasonal changes in sunshine hours are quite dramatic in Camaragibe. While November receives considerable daily sunshine with up to 8.9 hours, July marks the darkest time of the year, where sunshine is scarce with only 5.3 hours of sunlight per day.
Visit our detailed sunshine hours page for more information.
Monthly hours of sunshine
Daily hours of sunshine
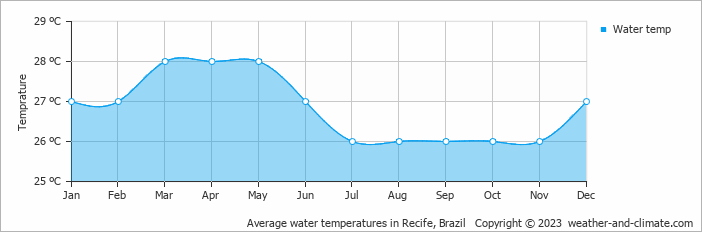
Water Temperature in Camaragibe
The mean water temperature over the year ranges from 26°C (79°F) in July to 28°C (82°F) in March.
Water temperature over the year
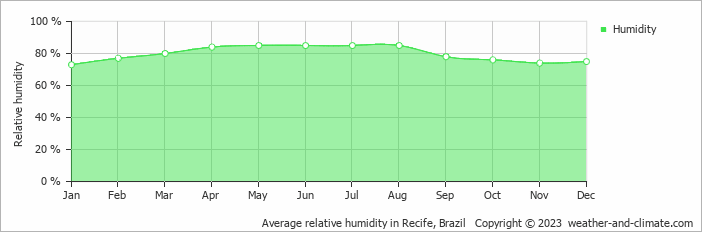
Humidity in Camaragibe by Month
The relative humidity is high throughout the year in Camaragibe.
The city experiences its highest humidity in May, reaching 85%. In January, the humidity drops to its lowest level at 73%. What does this mean? Read our detailed page on humidity levels for further details.
Relative humidity over the year
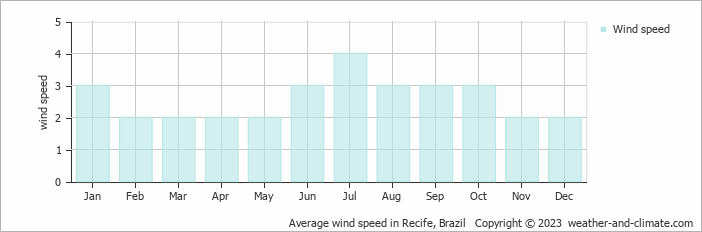
Wind Speed in Camaragibe
The mean wind speed over the year ranges from 2 m/s (4 knots) in February, March, April, May, November and December to 4 m/s (8 knots) in July. What does this mean?
The mean monthly wind speed over the year (meters per second)
Camaragibe 3-Day Forecast
Check the conditions for any month of the year.
Best Time to Visit Camaragibe
In general, temperatures in Camaragibe range from 28°C (82°F) to 32°C (90°F) across the year, with October, November and December being the best time to visit for those who prefer drier weather.Make your experience more enjoyable by planning to be outside during the cooler parts of the day, either early morning or as the sun begins to set. Seeking the perfect travel destination for this year? We've created a tool that suggests locations matching your desired weather. Let our weather planner guide your travel decisions.