Bø Andøya Weather and Climate: A Comprehensive Guide
Bø Andøya experiences great temperature shifts.
The city's weather can transition from mild days
to cold weather.
It is also known for its large amounts of rain/snowfall.
Let’s explore the climate details in depth to provide you with a complete overview.
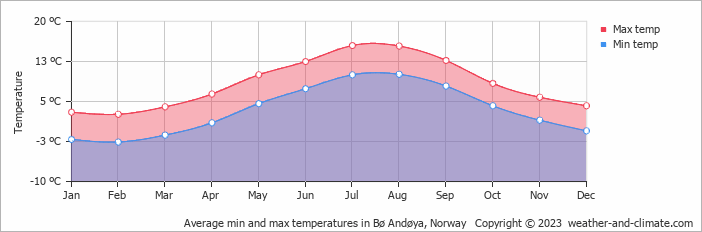
Average maximum day and minimum night temperature
The climate in Bø Andøya is known for significant temperature differences throughout the year, making the weather dynamic. Typically, average maximum daytime temperatures range from a moderate 16°C in July to a chilly 3°C in the coolest month, February.
Nights are cooler, with lows often dropping to around -3°C during the colder months.Check out our detailed temperature page for more information.
Temperature ranges by month
Precipitation and rainy days
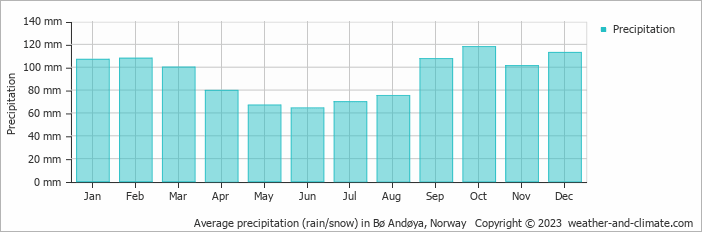
Bø Andøya has a notably wet climate with abundant precipitation, recording 1109 mm of rain/snowfall per year. Bø Andøya offers a pleasant mix of wetter and slightly drier months. The difference in precipitation between October (118 mm) and June (64 mm) is not too significant, making the climate enjoyable for visitors and residents alike.
The mean monthly precipitation over the year, including rain, hail and snow
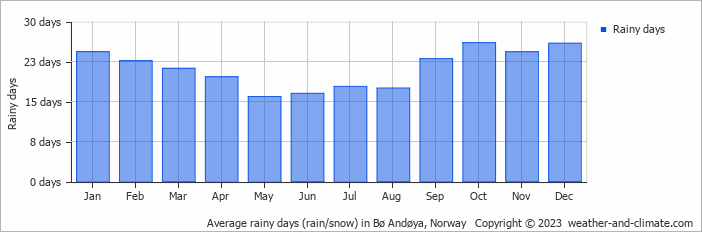
The average number of days each month with precipitation
Forecast for Bø Andøya


Select a Month of Interest
Check the conditions for any month of the year.
The best time of year to visit Bø Andøya in Norway
Other facts from our historical weather data:July has an average maximum temperature of 16°C and is the warmest month of the year.
The coldest month is February with an average maximum temperature of 3°C.
October tops the wettest month list with 118 mm of rainfall.
June is the driest month with 64 mm of precipitation.
No idea where to travel to this year? We have a tool that recommends destinations based on your ideal conditions. Find out where to go with our weather planner.