Belle Mare Weather and Climate: A Comprehensive Guide
Belle Mare has pretty similar weather over the course of the year.
It also has a relatively rainy climate with high levels of precipitation.
Let’s explore the climate details in depth to provide you with a complete overview.
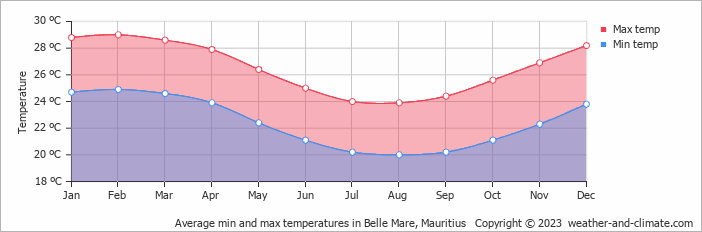
Average maximum day and minimum night temperature
In Belle Mare temperatures are generally consistent throughout the year. On average, daytime temperatures range from a comfortable 29°C in February to a comfortable 24°C in August.
Nighttime temperatures can drop, with average lows reaching 20°C in August. Check out our detailed temperature page for more information.Temperature ranges by month
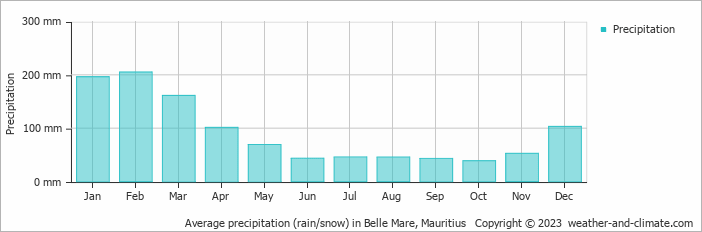
Precipitation and rainy days
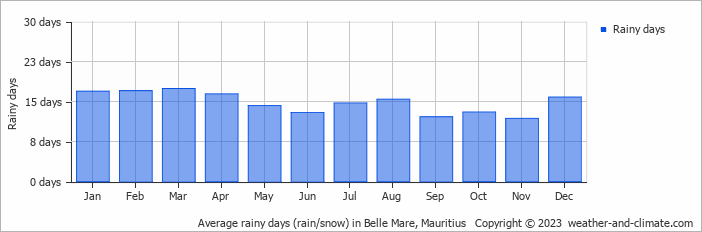
Belle Mare experiences significant rainfall throughout the year, averaging 1104 mm of precipitation annually. The seasons in Belle Mare, bring significant changes in precipitation. The wettest month, February, receives heavy rainfall, with an average of 205 mm of precipitation. This rainfall is distributed across 17 rainy days. In contrast, the driest month, October, experiences much less rainfall, totaling 39 mm over 13 rainy days. These distinct seasonal differences provide diverse experiences throughout the year. For more details, please visit our Belle Mare Precipitation page.The mean monthly precipitation over the year, including rain, hail and snow
The average number of days each month with precipitation
Sunshine over the year
Belle Mare enjoys sunny spells year-round. December sees up to 9.4 hours of daily sunshine, perfect for a sunny trip. June, the least sunny month, still offers a generous 7.0 hours of sun despite this cloudier time of the year. Visit our detailed sunshine hours page for more information.Monthly hours of sunshine
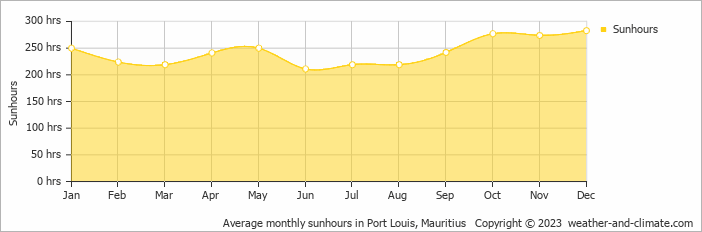
Daily hours of sunshine
partly cloudy and rain broken clouds and chance of rain partly cloudy and no rainForecast for Belle Mare
 6 m/s
6 m/s![]() 6 m/s
6 m/s![]() 4 m/s
4 m/s![]()
Select a Month of Interest
Check the conditions for any month of the year.
The best time of year to visit Belle Mare in Mauritius
During the months of June, July, August, September and October you are most likely to experience good weather with pleasant average temperatures that fall between 20°C and 26°C.Other facts from our historical weather data:
Most rainfall (rainy season) is seen in January, February and March.
February has an average maximum temperature of 29°C and is the warmest month of the year.
The coldest month is August with an average maximum temperature of 24°C.
February tops the wettest month list with 205 mm of rainfall.
October is the driest month with 39 mm of precipitation.
December is the sunniest month with an average of 283 hours of sunshine.
No idea where to travel to this year? We have a tool that recommends destinations based on your ideal conditions. Find out where to go with our weather planner.


