Banjole Weather and Climate: A Comprehensive Guide
The climate is warm but mild in Banjole. It has no dry periods and an annual average temperature of 15°C. The average amount of rain is 915 mm a year.
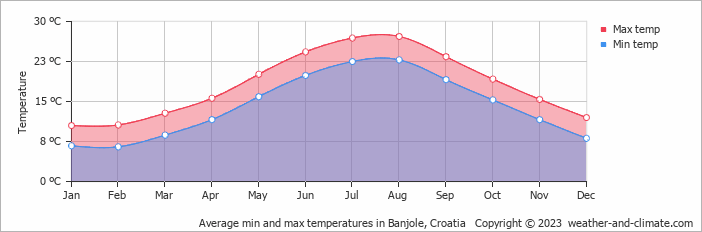
Average maximum day and minimum night temperature
Visitors to Banjole can expect significant temperature changes throughout the year. Average maximum daytime temperatures range from a comfortable 27°C in August, the warmest time of the year, to a chilly 11°C during cooler months like February.
At night, temperatures typically drop to an average of around 7°C during these months.Check out our detailed temperature page for more information.
Temperature ranges by month
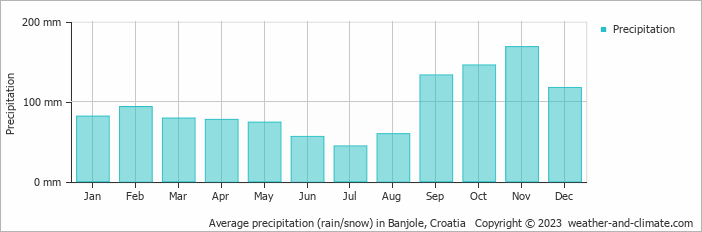
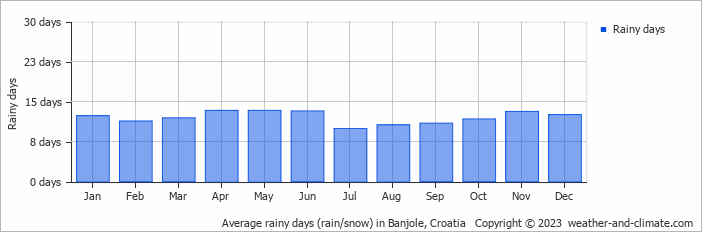
Precipitation and rainy days
Banjole is known for its substantial rainfall, with annual precipitation reaching 1130 mm. Significant seasonal changes in precipitation occur throughout the year. During the wetter season, November receives heavy rainfall, averaging 168 mm of precipitation, recorded across 13 rainy days. In contrast, the drier season, July brings less rainfall, with 44 mm over 10 rainy days. For more details, please visit our Banjole Precipitation page.
The mean monthly precipitation over the year, including rain, hail and snow
The average number of days each month with precipitation
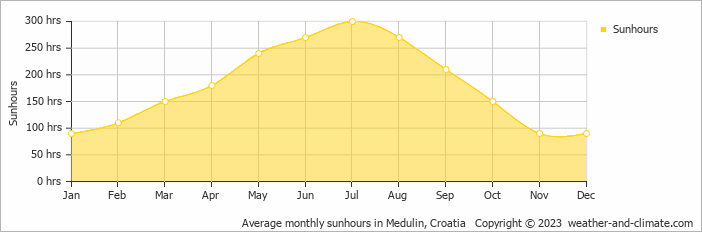
Sunshine over the year
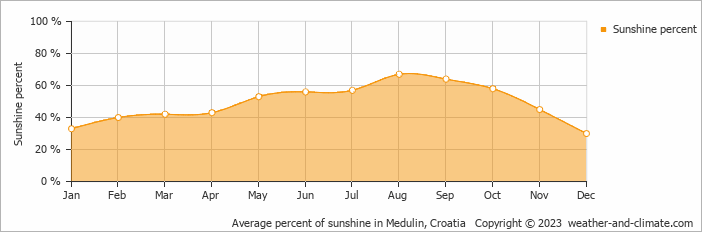
Seasonal changes in sunshine hours are quite dramatic in Banjole. While July receives considerable daily sunshine with up to 10.0 hours, January marks the darkest time of the year, where sunshine is scarce with only 3.0 hours of sunlight per day.
Visit our detailed sunshine hours page for more information.
Monthly hours of sunshine
Daily hours of sunshine
Daily percentage of sunshine
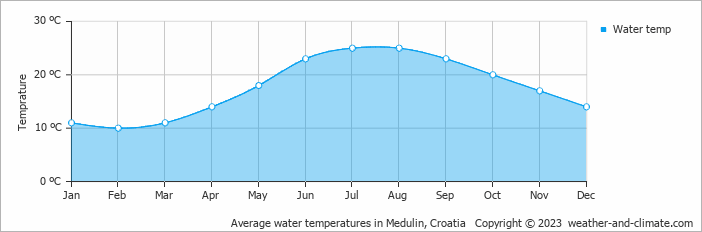
Average water temperature
The mean water temperature over the year ranges from 10°C in February to 25°C in July.
Water temperature over the year
Forecast for Banjole

Select a Month of Interest
Check the conditions for any month of the year.
The best time of year to visit Banjole in Croatia
During the months of May, June and September you are most likely to experience good weather with pleasant average temperatures that fall between 20°C and 26°C.Other facts from our historical weather data:
August has an average maximum temperature of 27°C and is the warmest month of the year.
The coldest month is February with an average maximum temperature of 11°C.
November tops the wettest month list with 168 mm of rainfall.
July is the driest month with 44 mm of precipitation.
July is the sunniest month with an average of 300 hours of sunshine.
No idea where to travel to this year? We have a tool that recommends destinations based on your ideal conditions. Find out where to go with our weather planner.


