Ban Thung Weather & Climate: Best Time to Visit
Average temperatures, rainfall, sunshine and the best time to visit Ban Thung.
Climate overview of Ban Thung
The climate in Ban Thung, Thailand, is remarkably consistent, with temperatures year-round averaging 30°C (86°F). The warmest month is May at 31°C (88°F), and the coolest is January at 29°C (84°F).
Rainfall is high, totalling around 1655 mm (65 in) per year. November is the wettest month and February the driest. Sunshine peaks in March, when the city sees around 8.0 hours of sunshine per day.
Ban Thung Weather by Month
Pick a month to see the average temperature, rainfall and sunshine in Ban Thung — and find the best time to visit.
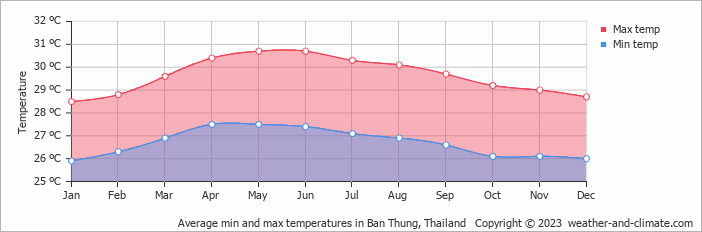
Monthly Temperature in Ban Thung
In Ban Thung temperatures are generally consistent throughout the year. Average maximum daytime temperatures range from a very warm 31°C (88°F) in May, the warmest time of the year, to a comfortable 29°C (84°F) during cooler months like January.
At night, you can expect temperatures ranging from 28°C (82°F) in May to around 26°C (79°F) during January.
Check out our detailed temperature page for more information.
Temperature ranges by month
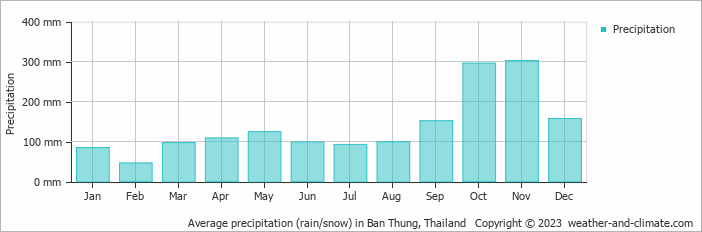
Rainfall in Ban Thung
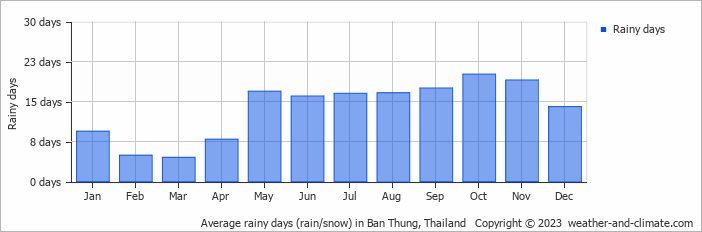
Ban Thung experiences significant rainfall throughout the year, averaging 1655 mm (65 in) of precipitation annually. Significant seasonal changes in precipitation occur throughout the year. In the wettest month, November it receives heavy rainfall, averaging 302 mm (12 in) of precipitation, recorded across 19 rainy days. In contrast, the driest month February brings less rainfall, with 46 mm (1.8 in) over 5 rainy days. For more details, please visit our Ban Thung Precipitation page.
The mean monthly precipitation over the year, including rain, hail, and snow
The average number of days each month with precipitation
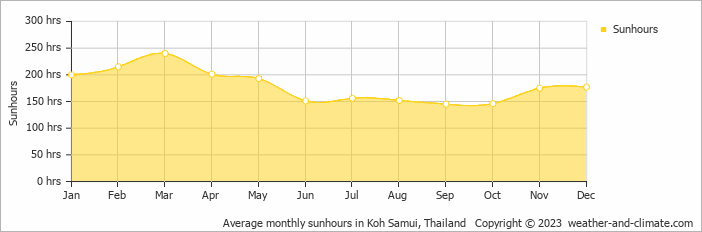
Sunshine Hours in Ban Thung
Seasonal changes in sunshine hours are quite dramatic in Ban Thung. While March receives considerable daily sunshine with up to 8.0 hours, September marks the darkest time of the year, where sunshine is scarce with only 4.8 hours of sunlight per day.
Visit our detailed sunshine hours page for more information.
Monthly hours of sunshine
Daily hours of sunshine
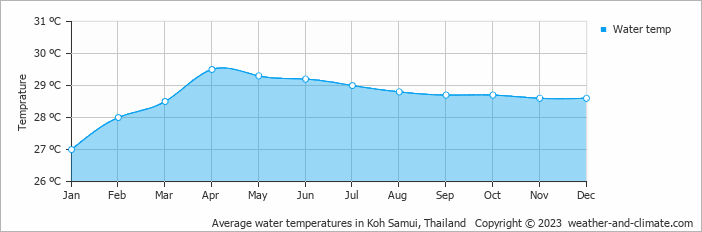
Water Temperature in Ban Thung
The mean water temperature over the year ranges from 27°C (81°F) in January to 30°C (86°F) in April.
Water temperature over the year
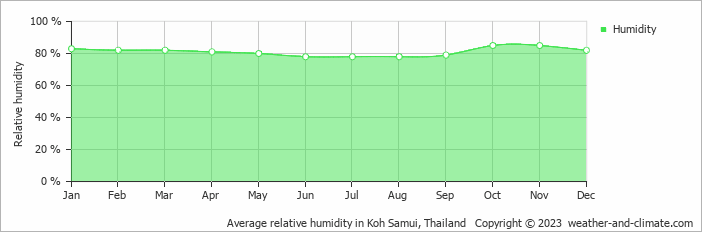
Humidity in Ban Thung by Month
The city experiences its highest humidity in October, reaching 85%. In June, the humidity drops to its lowest level at 78%. What does this mean? Read our detailed page on humidity levels for further details.
Relative humidity over the year
Best Time to Visit Ban Thung
To make the most of your visit, consider exploring early in the morning or during the pleasant late afternoon hours when the temperature is most comfortable.
Be aware that October and November constitute the rainy season, with significant precipitation. Need help choosing your next travel destination? We offer a specialized tool that matches you with locations based on your weather preferences. Explore destinations that suit your climate preferences.
Frequently asked questions about the climate in Ban Thung
What is the best time to visit Ban Thung?
January and February typically offer the most optimal weather in Ban Thung. In contrast, October and November tend to have less optimal conditions.
What temperatures can I expect in Ban Thung?
Daytime highs range from 29°C (84°F) in January to 31°C (88°F) in May. Nighttime lows range from 26°C (79°F) to 28°C (82°F). Temperatures stay relatively stable year-round.
How much rain does Ban Thung get?
Annual rainfall is around 1655 mm (65 in). November is the wettest month with 302 mm (12 in), while February is the driest with 46 mm (1.8 in).
How sunny is Ban Thung?
Ban Thung receives around 2,151 hours of sunshine per year. March is the sunniest month with 240 hours, while September is the cloudiest with just 145 hours. Overall, Ban Thung enjoys abundant sunshine.
Ban Thung 3-Day Forecast
Ban Thung 3-Day Forecast
Ban Thung on the map
Ban Thung is highlighted — select any city to see its climate.
Popular this month
Where to go in June — average daytime high across popular destinations.
Bucket list
Need travel inspiration? Check out our bucket list articles and be inspired.
 Discover Kok Kood: a hidden gem in Thailand
Discover the hidden gem of Thailand - Koh Kood! Explore stunning beaches, waterfalls and eco-friendly resorts while enjoying a peaceful atmosphere away from the crowds.
Discover Thailand: An Ultimate Guide for Yogis
Explore Thailand's best for yogis: serene retreats, spiritual growth, and adventure. Dive into yoga, meditation, and nature's tranquility for an unforgettable journey.
Trekking in Northern Thailand
One of the most beautiful attractions in Thailand is trekking along mountain villages north of Chiang Mai. The best time to trek is November until February.
Elephant Haven in Thailand: Kindred Spirit Sanctuary
Explore the Kindred Spirit Elephant Sanctuary in Thailand. Experience hiking, observe elephants in nature, and see the positive impact on the community.