Ban Pa Ton Weather & Climate: Best Time to Visit
Average temperatures, rainfall, sunshine and the best time to visit Ban Pa Ton.
Climate overview of Ban Pa Ton
Ban Pa Ton, Chiang Mai Province, Thailand, has a moderate seasonal temperature range, with April reaching 38°C (100°F) and December cooling to 30°C (86°F).
Rainfall is high, totalling around 1177 mm (46 in) per year. August is the wettest month and February the driest. The city also experiences distinct dry (November to April) and wet (July to September) seasons. March is the sunniest month, averaging 9.8 hours of sunshine per day.
Ban Pa Ton Weather by Month
Pick a month to see the average temperature, rainfall and sunshine in Ban Pa Ton - and find the best time to visit.
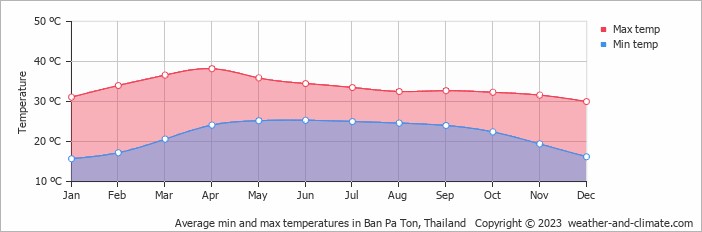
Monthly Temperature in Ban Pa Ton
The climate in Ban Pa Ton experiences moderate temperature changes, with mild shifts between seasons. Average maximum daytime temperatures range from a very hot 38°C (100°F) in April, the warmest time of the year, to a very warm 30°C (86°F) during cooler months like December.
At night, you can expect temperatures ranging from 25°C (77°F) in April to around 16°C (61°F) during December.
Check out our detailed temperature page for more information.
Temperature ranges by month
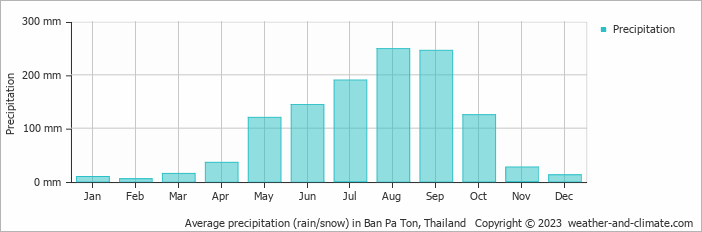
Rainfall in Ban Pa Ton
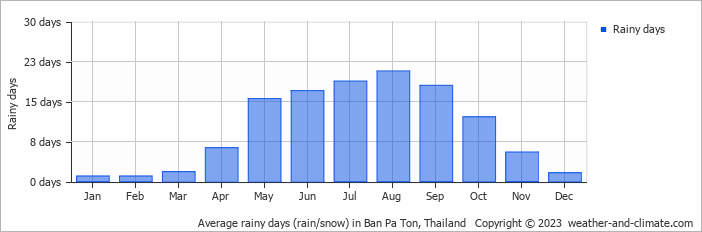
Ban Pa Ton is known for its substantial rainfall, with annual precipitation reaching 1177 mm (46 in). Significant seasonal changes in precipitation occur throughout the year. In the wettest month, August it receives heavy rainfall, averaging 249 mm (9.8 in) of precipitation, recorded across 21 rainy days. In contrast, the driest month February brings less rainfall, with 4.8 mm (0.2 in) over a single rainy day. For more details, please visit our Ban Pa Ton Precipitation page.
The mean monthly precipitation over the year, including rain, hail, and snow
The average number of days each month with precipitation
Sunshine Hours in Ban Pa Ton
Seasonal changes in sunshine hours are quite dramatic in Ban Pa Ton. While March receives considerable daily sunshine with up to 9.8 hours, August marks the darkest time of the year, where sunshine is scarce with only 3.9 hours of sunlight per day.
Visit our detailed sunshine hours page for more information.
Monthly hours of sunshine
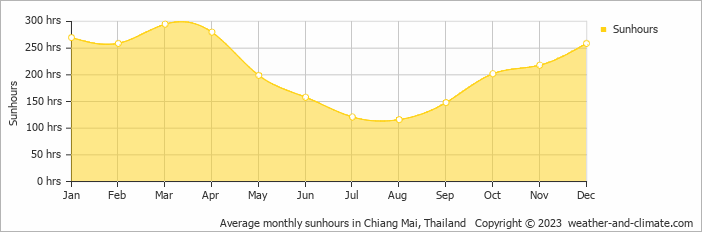
Daily hours of sunshine
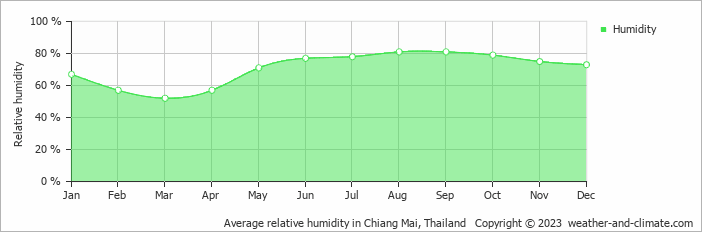
Humidity in Ban Pa Ton by Month
The relative humidity is high throughout the year in Ban Pa Ton.
The city experiences its highest humidity in August, reaching 81%. In March, the humidity drops to its lowest level at 52%. What does this mean? Read our detailed page on humidity levels for further details.
Relative humidity over the year
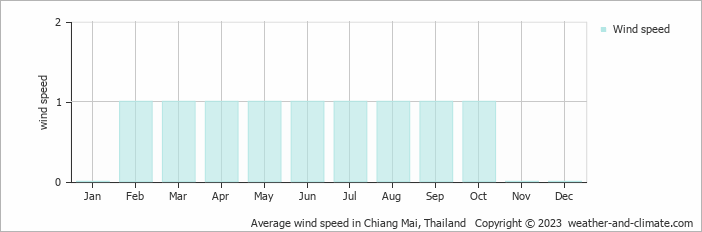
Wind Speed in Ban Pa Ton
The mean wind speed over the year ranges from () in January, November and December to 1 m/s (2 knots) in February, March, April, May, June, July, August, September and October. What does this mean?
The mean monthly wind speed over the year (meters per second)
Best Time to Visit Ban Pa Ton
Monthly ratings reflect general weather comfort, based on daytime temperature and rainfall. Swimming and winter conditions are highlighted separately where relevant.
- Best overall: January, November and December
- Warmest weather: April
- Most sunshine: March
- Fewest rainy days: January, February, March and December
- Wettest months: May, June, July, August, September and October, when rainfall is highest.
- Seasonal pattern: Distinct dry (November to April) and wet (July to September) seasons
Frequently asked questions about the climate in Ban Pa Ton
What is the best time to visit Ban Pa Ton?
January, November and December typically offer the most optimal weather in Ban Pa Ton. In contrast, February, March, April, May, June, July, August and September tend to have less optimal conditions. Ban Pa Ton has distinct dry (November to April) and wet (July to September) seasons.
What temperatures can I expect in Ban Pa Ton?
Daytime highs range from 30°C (86°F) in December to 38°C (100°F) in April. Nighttime lows range from 16°C (61°F) to 25°C (77°F).
How much rain does Ban Pa Ton get?
Annual rainfall is around 1177 mm (46 in). August is the wettest month with 249 mm (9.8 in), while February is the driest with 4.8 mm (0.2 in).
How sunny is Ban Pa Ton?
Ban Pa Ton receives around 2,525 hours of sunshine per year. March is the sunniest month with 295 hours, while August is the cloudiest with just 116 hours. Overall, Ban Pa Ton enjoys abundant sunshine.
Ban Pa Ton 3-Day Forecast
Ban Pa Ton 3-Day Forecast
Ban Pa Ton on the map
Ban Pa Ton is highlighted - select any city to see its climate.
Popular this month
Where to go in July - average daytime high across popular destinations.
Bucket list
Need travel inspiration? Check out our bucket list articles and be inspired.
 Discover Kok Kood: a hidden gem in Thailand
Discover the hidden gem of Thailand - Koh Kood! Explore stunning beaches, waterfalls and eco-friendly resorts while enjoying a peaceful atmosphere away from the crowds.
Discover Thailand: An Ultimate Guide for Yogis
Explore Thailand's best for yogis: serene retreats, spiritual growth, and adventure. Dive into yoga, meditation, and nature's tranquility for an unforgettable journey.
Trekking in Northern Thailand
One of the most beautiful attractions in Thailand is trekking along mountain villages north of Chiang Mai. The best time to trek is November until February.
Elephant Haven in Thailand: Kindred Spirit Sanctuary
Explore the Kindred Spirit Elephant Sanctuary in Thailand. Experience hiking, observe elephants in nature, and see the positive impact on the community.