Bajamar Weather & Climate: Best Time to Visit
Bajamar, Canary Islands, Spain, enjoys a steady climate throughout the year, with daytime temperatures typically around 21°C (70°F). September is the warmest month at 24°C (75°F), while February is the coolest at 19°C (66°F).
With around 286 mm (11 in) of annual rainfall, Bajamar has a fairly dry climate. However, it has a distinct dry season from January to December. The wettest month is December, while August sees the least rain. The sunniest month is July, with 11.1 hours of sunshine per day on average.
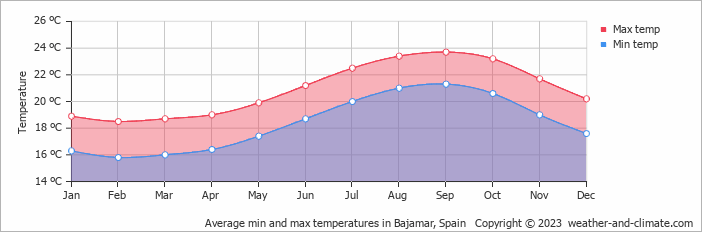
Monthly Temperature in Bajamar
The temperature in Bajamar remains steady throughout the year, providing a consistently comfortable climate. Average daytime temperatures reach a comfortable 24°C (75°F) in September. In February, the coolest month of the year, temperatures drop to a pleasant 19°C (66°F).
At night, temperatures range from around 21°C (70°F) in September to 16°C (61°F) in February.
Check out our detailed temperature page for more information.
Temperature ranges by month
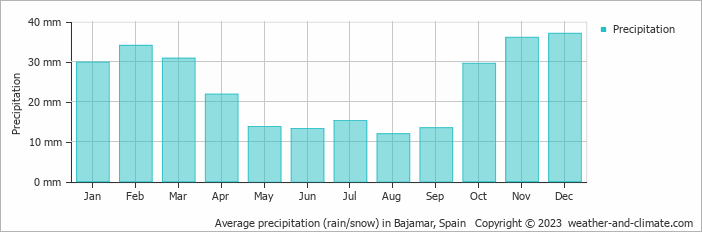
Rainfall in Bajamar
With annual rainfall averaging 286 mm (11 in), Bajamar maintains relatively low precipitation levels throughout the seasons. Bajamar can be quite wet during December, receiving approximately 37 mm (1.5 in) of precipitation over 8 rainy days.
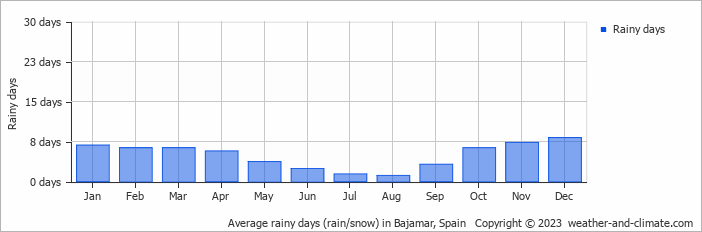
In contrast, during the driest month (August), you will experience much drier conditions, with 12 mm (0.5 in) of precipitation spread across a single rainy day days. For more details, please visit our Bajamar Precipitation page.
The mean monthly precipitation over the year, including rain, hail, and snow
The average number of days each month with precipitation
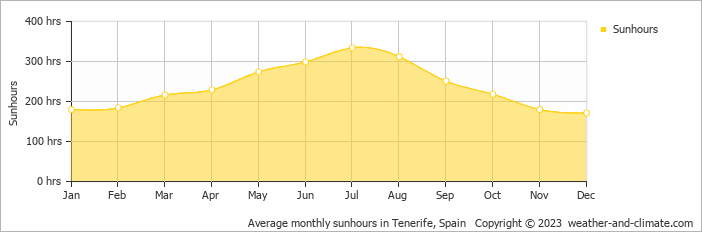
Sunshine Hours in Bajamar
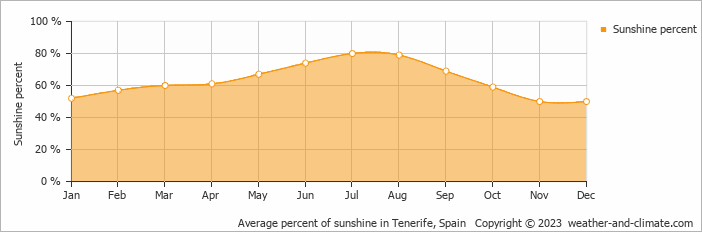
Bajamar can be enjoyed more throughout the sunniest month of July under a blue sky, with approximately 11.1 hours of sunshine daily. In contrast, the city experiences much darker days in December, with only 5.7 hours of sunlight per day.
Visit our detailed sunshine hours page for more information.
Monthly hours of sunshine
Daily hours of sunshine
Daily percentage of sunshine
Water Temperature in Bajamar
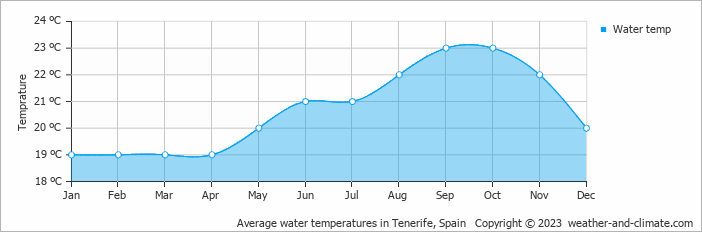
The mean water temperature over the year ranges from 19°C (66°F) in January to 23°C (73°F) in September.
Water temperature over the year
Humidity in Bajamar by Month
The relative humidity is high throughout the year in Bajamar.
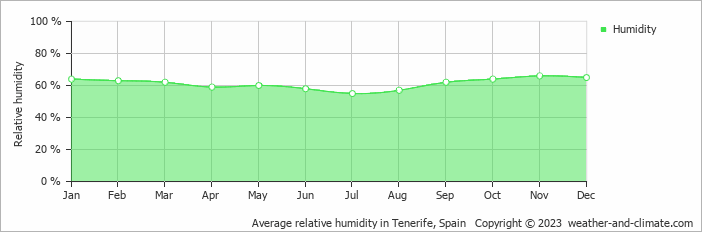
The city experiences its highest humidity in November, reaching 66%. In July, the humidity drops to its lowest level at 55%. What does this mean? Read our detailed page on humidity levels for further details.
Relative humidity over the year
Bajamar 3-Day Forecast
Check the conditions for any month of the year.
Best Time to Visit Bajamar
Bajamar offers comfortable weather throughout the entire year, with temperatures consistently ranging from 19°C (65°F) to 24°C (75°F) across all twelve months. This exceptional climate stability makes it a year-round destination, though the drier months provide the best visiting conditions.Rainfall varies from 12 mm (0.5 in) in August to 37 mm (1.5 in) in December. The drier months like August offer the most pleasant conditions for exploring the area. Wondering where to travel based on your weather preferences? Our recommendation tool helps you find destinations with your ideal climate conditions. Use our weather planner to find your perfect destination.


